30th May 2014
Positional differences and performance by position are interesting ways to look at team performance. For instance as Phillies fan I know that CF and LF are hurting the Phillies, but just how much are they hurting relative to the league. This tool answers that question and many many more. (answer: a whole lot of hurt)
You select a year, the league and a stat, and we rank every team at each position by that stat and in some cases a summary of positions. This uses our positional splits to allot stats to positions or in some cases a prorated assignment of WAR and related stats by time played at each position. Now in one table you can see the worst or best team-positions in baseball.
There are some additional tools that allow you to highlight a particular team and mousing over a table cell informs you the players involved in producing that value.
I like this output so much I've also added it to our base league pages just below the pitching stats.
2014 AL League page
Team Comparison Tool - Baseball-Reference.com.
Posted in Advanced Stats, Announcement, Baseball-Reference.com, Features, Statgeekery | 6 Comments »
23rd May 2014
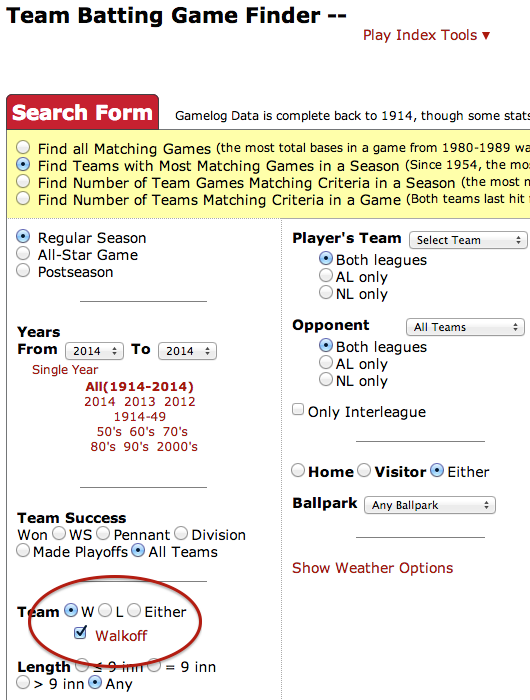
I'm not sure why it took me 8 years to do this, but you can now search for walkoffs in the game finder play index tools.
Using the game finder you can find all of the walkoff wins and losses for your team. Using the controls at the top you can even see who's had the most walkoff wins or losses in a season. Please keep in mind that this is 100% complete back to 1974 and then will get progressively less complete back to 1940, though still pretty good. You can always check our coverage page to figure out what might be missing. When searching for walkoffs, we will also print out the type of play and the batter and pitcher involved, since we know that's what you want to see.
Read the rest of this entry
Posted in Announcement, Baseball-Reference.com, Play Index, Statgeekery, Uncategorized | 6 Comments »
1st April 2014
Practice Shot Charts.
NBA.com has really upped the level of detail they've added, so we're trying to respond with the latest and greatest data we can get. We've recently come to an agreement with a number of franchises for access to their practice film and have begun breaking down scrimmage data.
Practice shot charts seem to us the next frontier in basketball analytics. This data will show you who's improving, who isn't, and who is working on new aspects of their game. It's especially useful for players without a lot of playing time.
Before we roll it out sidewide, we've prepared some sample charts.
Posted in Advanced Stats, Announcement, Basketball-Reference.com, expire10d, Most Wanted, Stat Questions, Statgeekery, Uncategorized | 3 Comments »
6th January 2014
User Affairs Coordinator @ Sports Reference.
Yes, we'll pay you money to spend all day answering questions about sports. Please pass along this job ad to anyone you might think would be interested.
Posted in Advanced Stats, Announcement, Baseball-Reference.com, Basketball-Reference.com, CBB at Sports Reference, CFB at Sports Reference, Expire30d, Hockey-Reference.com, Olympics at S-R, Pro-Football-Reference.com, Statgeekery, Tips and Tricks, WAR | 5 Comments »
9th December 2013
Chase asked where FSU's +42.3 pre-bowl PPG differential ranked among all BCS-bowl teams historically, so I thought I'd run a quick database search:
Read the rest of this entry
Posted in Advanced Stats, Announcement, CFB at Sports Reference, History, Pro-Football-Reference.com, SRS, Stat Questions, Statgeekery, Trivia | 6 Comments »
6th December 2013
Today, we added a new feature to Basketball-Reference: historical team Pace Factors and Offensive/Defensive Rating estimates.
As of yesterday, we only had Pace and ORtg/DRtg for NBA teams going back to 1973-74, the first season in which the league tracked team/opponent turnovers and offensive rebounds (which are, of course, necessary to the possessions formula). However, it is possible to estimate possessions for years prior to '74 -- an idea I developed casually at the old BBR Blog in 2010, and one which was expanded on in more detail by ElGee35 at his (now-defunct) blog in 2012.
Read the rest of this entry
Posted in Announcement, Basketball-Reference.com, Data, Features, History, Statgeekery | 5 Comments »
5th December 2013
I don't think it's a secret that the sabermetric case for Jack Morris is an especially thin one. A ranking using WAR has him about the 25th best player on the ballot. But we hear all of these stats about how much of a workhorse Morris was. Here is an example from Tom Verducci. Now it's true that Morris pitched into the 8th the most of his era, but when he did he was actually way below average among of group of pitchers who pitched 100+ outings of that length.
Morris worked deep in the games, but it was largely due to usage rather than effectiveness. When he went 8 innings he was league average, when he went five innings he was league average. The chart below shows the number of innings completed by the starter per start. So the "0" row is not all first innings, but just the games they didn't make it out of the first inning. Their complete games would be in the 9 row. Now there is a value to pitching late into games and Morris should be credited by that value, but it certainly looks to me that a big reason Morris went late into games was the astronomical run support he was getting not because he was pitching so much better than the average pitcher. Note that for outings last one inning or longer Morris' RA is WORSE than league average for every single outing length.
|
All AL SP's 1975-1997 |
Jack Morris |
Frank Tanana (1975 on) |
| completed innings |
% of all GS |
W-L% |
RA |
tmAvgRS |
% of all GS |
W-L% |
RA |
tmAvgRS |
% of all GS |
W-L% |
RA |
tmAvgRS |
| 0 |
1.3 |
0.000 |
89.23 |
4.86 |
0.6 |
0.000 |
64.80 |
5.67 |
1.5 |
0.000 |
83.45 |
5.38 |
| 1 |
2.7 |
0.000 |
29.29 |
4.61 |
1.1 |
0.000 |
33.48 |
4.33 |
2.0 |
0.000 |
31.30 |
4.73 |
| 2 |
4.2 |
0.000 |
18.00 |
4.62 |
2.5 |
0.000 |
20.90 |
4.00 |
3.6 |
0.000 |
19.13 |
4.10 |
| 3 |
5.9 |
0.000 |
13.06 |
4.60 |
3.2 |
0.000 |
13.81 |
5.24 |
3.6 |
0.000 |
13.23 |
4.60 |
| 4 |
8.0 |
0.001 |
10.00 |
4.52 |
6.3 |
0.000 |
12.39 |
4.58 |
5.1 |
0.000 |
9.80 |
4.61 |
| 5 |
14.0 |
0.412 |
6.45 |
4.94 |
5.7 |
0.375 |
8.79 |
4.50 |
9.9 |
0.324 |
6.91 |
4.94 |
| 6 |
18.4 |
0.504 |
4.78 |
4.62 |
12.3 |
0.540 |
5.78 |
5.80 |
17.2 |
0.500 |
4.95 |
4.78 |
| 7 |
18.4 |
0.637 |
3.43 |
4.51 |
21.3 |
0.730 |
3.94 |
5.88 |
21.9 |
0.633 |
3.51 |
4.70 |
| 8 |
12.3 |
0.545 |
2.93 |
3.75 |
19.5 |
0.413 |
3.86 |
3.83 |
15.1 |
0.368 |
3.00 |
2.86 |
| 9 |
14.1 |
0.842 |
1.68 |
4.91 |
26.0 |
0.867 |
1.77 |
4.53 |
18.8 |
0.880 |
1.48 |
4.97 |
| 10 |
0.5 |
0.713 |
1.88 |
2.76 |
1.3 |
0.250 |
2.44 |
2.14 |
0.4 |
0.000 |
0.90 |
0.50 |
| 11 |
0.1 |
0.667 |
1.63 |
2.54 |
0.2 |
|
1.64 |
3.00 |
0.4 |
1.000 |
0.82 |
2.50 |
| 12 |
0.0 |
0.667 |
1.59 |
2.75 |
|
|
|
|
0.2 |
|
3.00 |
5.00 |
| 13 |
0.0 |
|
0.59 |
2.57 |
|
|
|
|
0.4 |
|
0.00 |
1.50 |
| 14 |
0.0 |
0.750 |
1.77 |
4.25 |
|
|
|
|
|
|
|
|
It seems to me if the basis of your argument for Morris in the HOF was that he pitched deep into a lot of games (and was about avg in those outings) then you have a pretty weak argument. The summary of our view is that Morris was a pretty good pitcher on very good teams, but really is not a whole lot better than someone like David Wells or Frank Tanana. And certainly not better than Mike Mussina or Kevin Brown.
Posted in Announcement, Baseball-Reference.com, Hall of Fame, Stat Questions, Statgeekery | 95 Comments »
14th October 2013
Last night's Ortiz Grand Slam was the first in the postseason and 8th time in the RetroSheet canon (but probably overall) that four pitchers received earned runs on one play.
| game_id      | result_batter | batting_team_id | pitching_team_id | event_text           | home      | first     | second    | third     |
+--------------+---------------+-----------------+------------------+----------------------+-----------+-----------+-----------+-----------+
| BOS201310130 | ortizda01     | BOS             | DET              | HR/9/L9D.3-H;2-H;1-H | benoijo01 | albural01 | smylydr01 | verasjo01 |
+--------------+---------------+-----------------+------------------+----------------------+-----------+-----------+-----------+-----------+
+--------------+---------------+-----------------+------------------+-------------------------+-----------+-----------+-----------+-----------+
| game_id      | result_batter | batting_team_id | pitching_team_id | event_text              | home      | first     | second    | third     |
+--------------+---------------+-----------------+------------------+-------------------------+-----------+-----------+-----------+-----------+
| MIN196107041 | becquju01     | MIN             | CHW              | HR/9D.3-H;2-H;1-H       | hackewa02 | baumafr01 | kemmeru01 | piercbi02 |
| SEA198208060 | jacksre01     | CAL             | SEA              | HR/9.3-H;2-H;1-H        | vandeed01 | stantmi01 | anderla02 | bannifl01 |
| DET198307100 | parrila02     | DET             | OAK              | HR/7.3-H(UR);2-H;1-H    | jonesje01 | beardda01 | burgmto01 | codirch01 |
| SFN198709200 | esaskni01     | CIN             | SFG              | HR/7D.3-H;2-H;1-H       | perlmjo01 | leffecr01 | downske01 | robindo01 |
| SEA198805060 | sheripa01     | DET             | SEA              | HR/9.3-H;2-H;1-H        | jacksmi02 | solanju01 | powelde01 | mooremi01 |
| SDN200109010 | lankfra01     | SDP             | ARI              | HR/89.3-H;2-H;1-H       | kimby01   | sabeler01 | knotter01 | batismi01 |
| LAN200410020 | finlest01     | LAD             | SFG              | HR/89/F.3-H;2-H(UR);1-H | frankwa01 | hergema01 | chrisja01 | hermadu01 |
Posted in Advanced Stats, Announcement, Baseball-Reference.com, History, Stat Questions, Statgeekery, Trivia | 6 Comments »
12th August 2013
Just a quick note that our AV-based Similarity Scores have been updated for the first time in a few seasons, so guys like Joe Flacco now have similars.
Posted in Announcement, Features, History, Pro-Football-Reference.com, Statgeekery | Comments Off on PFR Similarity Scores Updated
9th August 2013
Jobs @ Sports Reference.
Sports Reference has an immediate opening for a web developer. Please see our job advertisement for all of the details. We will begin reviewing applications on August 26th.
Posted in Advanced Stats, All-Star, Announcement, Baseball-Reference.com, Basketball-Reference.com, Bleg, CBB at Sports Reference, CFB at Sports Reference, expire21d, General, Hockey-Reference.com, Olympics at S-R, Pro-Football-Reference.com, Statgeekery | 7 Comments »

We're Social...for Statheads
Every Sports Reference Social Media Account
Site Last Updated: Friday, May 1, 2:56PM
Question, Comment, Feedback, or Correction?
Subscribe to our Free Email Newsletter
Do you have a sports website? Or write about sports? We have tools and resources that can help you use sports data. Find out more.