Sports Reference Blog

Archive for the 'Statgeekery' Category

2025 MLB Marcel Projections Live

14th January 2025

Our Marcel the Monkey projections for the 2025 MLB season are now live. The Marcels projection system was originally developed by Tom Tango as the "minimum level of competence that you should expect from any forecaster." You can read more about these projections here. The projections are also live on our player pages.

Posted in Announcement, Baseball-Reference.com, Statgeekery | No Comments »

Corrections Applied to Historical Game-Level Team Turnovers on Basketball Reference

22nd October 2024

Basketball Reference is thrilled to announce a subtle, but meaningful, improvement to our game-level NBA statistics: the addition of 'team' turnovers to our single-game team turnover totals for all seasons back to 1993-94. Go ahead and read that again. And then maybe again. Again? Yes, it's a confusing word salad. But we'll explain. At least we'll try to! Read the rest of this entry

Posted in Announcement, Basketball-Reference.com, Data, History, Statgeekery | Comments Off on Corrections Applied to Historical Game-Level Team Turnovers on Basketball Reference

Missing Elgin Baylor Triple-Double Found

1st July 2024

We know that Elgin Baylor had 26 triple-doubles in his regular-season NBA career. However, for many years we have only known the particulars around 25 of the 26. We knew we were missing details on one in the 1962-63 season, but we weren't certain which one. We are happy to announce that we have discovered that this 'missing' triple-double occurred on March 1, 1963 in a game at the Chicago Coliseum against the Chicago Zephyrs (now known as the Washington Wizards). Baylor finished the game with 33 points, 15 rebounds and 10 assists. With the addition of this data, we now have the details on 3,450 of the 3,475 known triple-doubles in NBA history. Of the 25 triple-doubles we are missing details on, 14 of them belong to Bob Cousy. We know Cousy had 33 triple-doubles, but we have details on just 19 of them. If you have access to official scorer's reports for older NBA games, please let us know!

The official scorer's report for this game is attached below.

Below is the list of known triple-doubles for which we are missing details:

BOB COUSY MISSING TRIPLE-DOUBLES
1950-51 2
1951-52 1
1952-53 5
1953-54 1 (PROBABLY 11/1/53)
1955-56 4
1957-58 1

JOHN HAVLICEK MISSING TRIPLE-DOUBLES
1967-68 1

BILL RUSSELL MISSING TRIPLE-DOUBLES
1962-63 1

JERRY LUCAS MISSING TRIPLE DOUBLES
1968-69 1

DAVE DeBUSSCHERE MISSING TRIPLE DOUBLES
1965-66 1 (PROBABLY 12-14-65)

GENE SHUE MISSING TRIPLE DOUBLES
UNKNOWN (57-62) 2 (BOTH WITH PISTONS)

RED KERR MISSING TRIPLE DOUBLES
1965-66 1 (PROBABLY 12/14/65)

DICK McGUIRE MISSING TRIPLE DOUBLES
UNKNOWN (58-60) 1 (WITH PISTONS)

MEL HUTCHINS MISSING TRIPLE DOUBLE
1955-56 1 (PROBABLY 12/10/55)

MAURICE STOKES MISSING TRIPLE DOUBLE
1957-58 1

FRED SCHAUS MISSING TRIPLE DOUBLE
1951-52 1 (PROBABLY 3/16/52)

Posted in Announcement, Basketball-Reference.com, History, Statgeekery | Comments Off on Missing Elgin Baylor Triple-Double Found

2024 Preseason WAR Update is Live

19th March 2024

As the 2024 season begins, we have made some updates to our Wins Above Replacement calculations on Baseball Reference. You may notice some small changes to figures as you browse the site. As always, you can find full details on how we calculate WAR here. Read the rest of this entry

Posted in Advanced Stats, Announcement, Baseball-Reference.com, Data, Statgeekery, WAR | 1 Comment »

Historical East vs West Records Added to Basketball Reference

4th January 2024

Here at Basketball Reference we take our frivolities very seriously. So seriously that we have made a new addition to our Frivolities section: season-by-season breakdowns of how the Eastern and Western Conferences have fared against each other.

You can see, for instance, that the West has the upper hand thus far in 2023-24 after the East won the series for each of the last two seasons. Before those two seasons, the West won the series in 12 straight seasons and 21 of the previous 22. You can also see how dominant the East was from mid-50s through the 60s, and also for all of the 1980s.

One technical point to bear in mind with this data is that before the 1970-71 season, the NBA was split into Eastern and Western 'divisions' instead of 'conferences.'

Posted in Announcement, Basketball-Reference.com, Data, Features, History, Statgeekery | 1 Comment »

FBref Adds Advanced Data for Six New Leagues so the Next 8 Becomes the Next 14

27th September 2023

We are pleased to announce that our partnership with Stats Perform Opta has expanded to include six new leagues of advanced data.  This data not only includes the current seasons, but also 3-4 historical seasons.

The new leagues are

These pair with

  • England's Championship
  • United States and Canada's MLS
  • Mexico's Liga MX
  • Brazil's Serie A
  • The Netherlands' Eredivisie
  • Portugal's Primeira Liga
  • Conmebol's Copa Libertadores
  • UEFA's Europa Conference League

To form our Next 14 tier for scouting reports and the like.   This is all described on our scouting reports explainer.

Thank you for your support.  It allows use to expand our stats in more directions and continue to serve you better.

Posted in Announcement, FBref, Statgeekery, Uncategorized | Comments Off on FBref Adds Advanced Data for Six New Leagues so the Next 8 Becomes the Next 14

FBref: xG Now Appears on Each Club’s Goal Logs

17th November 2022

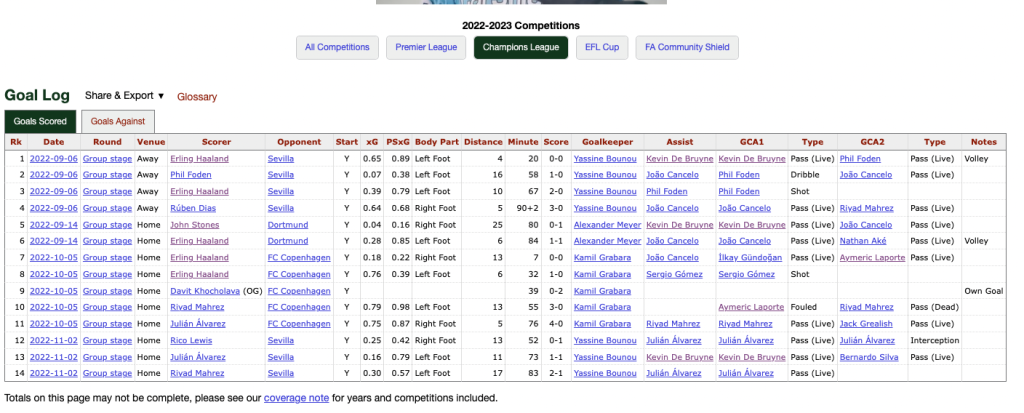
Thanks to our new data deal with Opta, we are now able to present xG and post-shot xG on our goal log pages for clubs and countries (look for it during the world cup). This data shows you the details of each of goal including the scorer, the body part used, xG, post-shot xG, any assist and the two players with goal creating actions prior to the goal.

We have the same information for goals allowed which allows you to see that both of the goals scored against Manchester City in the Champions League group stage were headers.

See our xG explainer for the full list of 120+ league seasons we've added this info for.

Posted in Announcement, FBref, Stat Questions, Statgeekery, Tips and Tricks | Comments Off on FBref: xG Now Appears on Each Club’s Goal Logs

Shot-by-Shot xG now on Player Goal Logs

14th November 2022

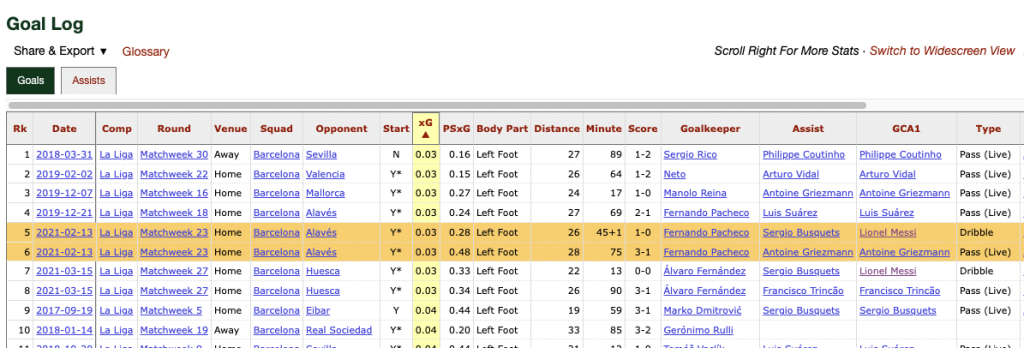
Thanks to our new data deal with StatsPerform/Opta we are now able to display xG data for individual goals and assists on our player goal logs. Using this information you can now find out things like Lionel Messi had two 0.03 xG goals in the same match vs Alavés on February 13, 2021.

These goal logs are available for all competitions we cover and include xG for the full set of Opta leagues we added last month.

Posted in Advanced Stats, Announcement, FBref, Statgeekery | Comments Off on Shot-by-Shot xG now on Player Goal Logs

New Sack Data Added for Quarterbacks

11th November 2022

Entering the 2022 NFL season, the NFL Record and Fact Book (the official record book of the National Football League) listed Ben Roethlisberger as the all-time leader in 'Most Time Sacked, Career' (as it is listed in the guide) with 554. Tom Brady was listed second with 543. Above this list is the note 'Times Sacked has been compiled since 1963."

Subsequently, Brady made a bit of news when he recently passed Big Ben to become the 'all-time' leader in Times Sacked.

Entering the season, Pro-Football-Reference would have listed the same leaderboard as the Record and Fact Book, though our statistics for this category went back to only 1969. However, thanks to the expert research of T.J. Troup, and some consultation with the great John Turney, our updated all-time 'Times Sacked' leaderboard also has a new leader. But it's not Tom Brady. It is Hall of Famer Fran Tarkenton. Read the rest of this entry

Posted in Announcement, History, Pro-Football-Reference.com, Statgeekery | 1 Comment »

August 2021 Park Factor Update

31st August 2021

Today we released an update to how we calculate one-year park factors for 2020 and three-year park factors that include 2020. In short, we are giving the observed effects of ballparks in 2020 less weight, impacting context-adjusted stats like ERA+, OPS+, Rbat+, and WAR for 2019 through 2021.

There are two reasons for this change. First, the shortened 60-game season decreases the sample of games we have data from, which naturally reduces the significance of the data collected. Second, since teams only played within their own divisions in 2020, comparing scoring in home games vs. scoring in away games does not tell an accurate story of how a park impacted scoring relative to league average, since most of the parks in the league are not included in either set of games (e.g. when computing the park factor for Wrigley Field, games played at Coors Field or Citizens Bank Park are not included in the calculation anywhere, since the Cubs did not play away games at those parks in 2020).

The issue with the way we had been handling 2020 park factors became more apparent as the 2021 season went on, particularly because the Cincinnati Reds’ 2020 park factor of 119 was raising the 2021 three-year park factor, resulting in worse-than-expected adjusted stats for hitters like Joey Votto, and better-than-expected adjusted stats for pitchers like Wade Miley.

Now, when you look at a 2020 team page, the one-year park factors have been diluted so that they include an average of 60 games’ worth of 2020 data, and 51 games each of 2019 and 2021 data. If there is no corresponding 2019 or 2021 data (e.g. new ballpark in Texas, different mix of parks for Toronto), those parts are replaced with a league-average park factor of 100. These new one-year park factors are used in the three-year averages like usual, so the effect is reflected there as well.

With this change, here are some of the most notable movers in Wins Above Replacement:

Zack Wheeler (+0.5) and Aaron Nola (+0.3) each saw a bump up in their 2021 pitching WAR as the 3-year park factor for Philadelphia rose from 96 to 98 (frequent opponent Washington also had their 3-year park factor increase from 93 to 96). Wheeler’s 0.5 is the largest change resulting from this update.

Wade Miley, Tyler Mahle, and Luis Castillo (-0.4 each) saw their 2021 pitching WAR fall. As mentioned above, Cincinnati saw some of the most anomalous park factors in 2020, and mitigating their impact here lowers the expected run environment for these and other Reds pitchers.

On the hitting side, the changes are more modest. Justin Upton and Isiah Kiner-Falefa each saw their 2021 batting WAR rise by 0.3, while Maikel Franco and J.T. Realmuto lost -0.3 from their 2021 WAR.

In 2021, Shohei Ohtani is notably untouched by this update, with changes to his batting WAR and pitching WAR canceling each other out and his 7.9 total WAR remaining the same.

Here is a full list of changes to park factors, rate stats, and Wins Above Replacement from before and after this change.

Posted in Advanced Stats, Announcement, Baseball-Reference.com, Statgeekery, WAR | Comments Off on August 2021 Park Factor Update