30th September 2014
Since we're busy adding targets (since 1998) everywhere, I've also put them on the player season finder tool, so for instance you can find the most targets since 1998, sorted by total receptions. In addition I've added Catch Percentage as a searchable and sortable item, the number of targets that actually turned into receptions - Marshall Faulk has the highest percentage of targets caught for players with 100+ targets in a season, and in 2014, Brent Celek has the lowest ratio of passes caught to targets among players with 10+ targets.
Posted in Announcement, Pro-Football-Reference.com | Comments Off on Search Targets and Catch Percentage from Player Season Finder
26th September 2014
Because it's Friday and an interesting trivia question, I went and looked it up in the database - it's actually not as uncommon as you'd think to win and lose in the same season by the same large point differential. The big winners (and losers, of course) in this category are the 1988 Saints managed to beat the Broncos 42-0 and two weeks later lose to Minnesota, 45-3. Here are the top 25 teams with a large win and corresponding large loss in in the same season since 1970:
+------------+---------+------+------+-------------+---+
| name       | year_id | w    | l    | points_diff | c |
+------------+---------+------+------+-------------+---+
| Saints     |    1988 |    1 |    1 |          42 | 2 |
| Patriots   |    1993 |    1 |    1 |          38 | 2 |
| Lions      |    2007 |    1 |    1 |          37 | 2 |
| Giants     |    2009 |    1 |    1 |          37 | 2 |
| Bengals    |    1988 |    1 |    1 |          35 | 2 |
| 49ers      |    2009 |    1 |    1 |          35 | 2 |
| Broncos    |    1979 |    1 |    1 |          35 | 2 |
| Jets       |    1976 |    1 |    1 |          34 | 2 |
| Lions      |    1991 |    1 |    1 |          32 | 2 |
| Vikings    |    1977 |    1 |    1 |          32 | 2 |
| Patriots   |    2003 |    1 |    1 |          31 | 2 |
| Bengals    |    1986 |    1 |    1 |          31 | 2 |
| Vikings    |    1989 |    1 |    1 |          31 | 2 |
| Jets       |    1986 |    1 |    1 |          31 | 2 |
| Redskins   |    2014 |    1 |    1 |          31 | 2 |
| Bills      |    2003 |    1 |    1 |          31 | 2 |
| Saints     |    1976 |    1 |    1 |          30 | 2 |
| Buccaneers |    1992 |    1 |    2 |          28 | 3 |
| Ravens     |    2008 |    1 |    1 |          28 | 2 |
| Chargers   |    1984 |    1 |    1 |          28 | 2 |
| Packers    |    1992 |    1 |    1 |          28 | 2 |
| Buccaneers |    1979 |    1 |    1 |          28 | 2 |
| Chiefs     |    1985 |    1 |    1 |          28 | 2 |
| Vikings    |    1982 |    1 |    1 |          28 | 2 |
| Broncos    |    2004 |    1 |    1 |          28 | 2 |
+------------+---------+------+------+-------------+---+
Posted in Pro-Football-Reference.com | 1 Comment »
25th September 2014
We've added advanced splits to our existing player splits pages, breaking down passing, rushing, and receiving performances by down, distance, score differential, quarter, and more, for every year from 1998 to 2014. Did you know that..
Note that you can always slice & dice the play-by-play data to your heart's content using our play finder tool, and we're also working on adding further splits, such as playing surface, weather, point spread, and more. If you have any suggestions, let us know in the comments below.
Posted in Announcement, Pro-Football-Reference.com | Comments Off on Advanced Player Splits Now Available
22nd September 2014
Just a quick note that we have added target data back to 1998 on our Fantasy pages. For instance, you can now see that Jordy Nelson leads all players with 37 targets thus far this season. This data is now live for 2014 and will be populating the pages for 1998-2013 soon. Hope everyone finds this info useful when they're setting their weekly lineups.
Posted in Announcement, Data, Pro-Football-Reference.com | 1 Comment »
17th September 2014
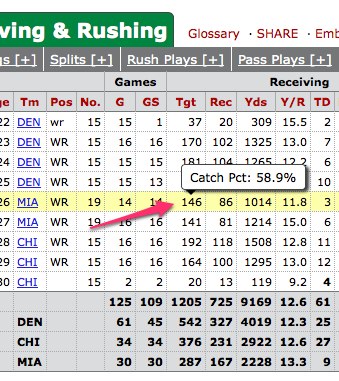
We've added pass target data to player pages and team pages since 1998 - see the 'Tgt' column under 'Receiving'. And if you mouse over the targets number, it will show you the player's catch percentage, defined as his number of receptions/number of targets.
This target data is derived from the play-by-play data that's used to populate our play finder tool, so when you see something in a box score like "Jay Cutler pass incomplete short left intended for Brandon Marshall", we are counting that as a target for Marshall as determined by the official scorer's judgement.
Look for these to be added to the player season finder and player game finder tools soon. And if you're curious, the most-targeted player in our DB is Marvin Harrison in 2002 with a whopping 205 targets, which might explain why he was able to set the single season receptions record that year.
Posted in Announcement, Pro-Football-Reference.com | 2 Comments »
15th September 2014
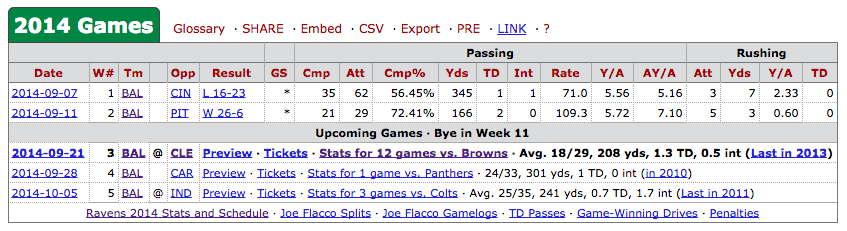
To help provide more insight into a player's current year performance, we've added a box with the current year's gamelogs to the top of every active player page highlighting this year's game lines. This box also lists his bye week, the next 3 opponents, and his per-game averages against each opponent at a glance, so you can to see Joe Flacco's career gamelogs vs. the Browns, for example. This box also has quick links to all career gamelogs, penalties, splits and more, for all your gameday number-crunching needs.
We've also added the ability to filter by team on each player game log page - just change the team in the select box above the table and you can break down career numbers vs. only that team (for example, Tom Brady vs. the Dolphins).
Posted in Announcement, Pro-Football-Reference.com | 1 Comment »
12th September 2014
By Dan Pizzuta
There's not many things in sports that can increase ticket prices on the secondary market like successful on-field performance. Generally the best teams have the highest ticket prices. However, early in the season some of the price points are still based on preseason expectations and on-field performance has not yet led to shifts in the market. That's especially true early in the college football season on the secondary market.
TiqIQ tracks the most average prices by school on the secondary market during the college football season with the TiqIQ Top 25. Of the schools with the 25 most expensive average prices, 12 are also currently in the Top 25 of SRS after two weeks of the season.
Through two games, the closest match between SRS and secondary market prices is Notre Dame. The Fighting Irish are ranked as the top team with a SRS of 56.99. Notre Dame football tickets are also the third most expensive on the secondary market with a $215 average price for 2014 home games. The University of Georgia is close to Notre Dame, ranking fourth in SRS and second on the secondary market as UGA football tickets have an average price of $219. The biggest disagreement between the two is Ohio State. Ohio State football tickets are the most expensive in the country with a $252 average price. Ohio State's average is 15 percent above the next school, however, they come in just 55th in SRS, 7.43 points above average.
Four of the top ten schools in SRS do not appear in the 25 most expensive schools on the secondary market. Of those four, only Michigan football tickets are the closest to cracking the Top 25. The Wolverines currently have the 26th highest average price in the country at $120. Home games on the Michigan football schedule are typically more expensive, but both high profile rivalry games against Notre Dame and Ohio State were scheduled on the road this season.
When it comes to average prices on the secondary market, there's not much of a difference between top offensive and defensive schools. Both eight of the top 25 schools in defensive and offensive SRS appear on the TiqIQ Top 25. The best defensive schools have a bit of an edge when the it comes to being top five units. Four of the top defensive teams in the TiqIQ Top 25 are in the top five in Defensive SRS. However only two of the eight offensive teams on the secondary market are top five in Offensive SRS--Georgia and Auburn.
Of the 25 most expensive schools on the secondary market, Auburn football tickets might be the best deal. The Tigers rank 14th on the TiqIQ Top 25 and third in SRS. They are only top secondary market school that rank in the top 25 in SRS for both offense and defense. For that type of balance, the $149 average price at Jordan Hare Stadium could be considered a steal.
Posted in Announcement, CFB at Sports Reference, Pro-Football-Reference.com | Comments Off on The Relationship Between Winning and Ticket Prices in College Football
29th August 2014
The
Play Index is the name we use to refer to PFR's collection of top-notch research tools. Read below for more information on some of the applications we have made available to you.
Search all plays from 1998 to today to find performances that match your criteria. Answer questions like…
Player Season Finder
Search through player season stats spanning from 1920 to today for single seasons or combined seasons that match your criteria. Answer questions like…
The answers to these questions and many, many more are at your fingertips using the Player Season Finder.
Player Game Finder
Search through player game logs spanning from 1960 to today for games that match your criteria. You can find…
With the Player Game Finder, the possibilities are almost endless.
Player Touchdown Finder
Search through every touchdown scored from 1920 to today for scores that match your criteria. Did you know…
Impress your friends and come up with your own "Did You Know" with a little help from the Player Touchdown Finder.
Team Game Finder
Find team games or seasons matching certain criteria. Did you know…
Player Streak Finder
Find the longest player streaks matching certain criteria. Did you know...
Team Streak Finder
Find the longest team streaks matching certain criteria. Did you know...
Super Bowl Play Finder
Search through every play in Super Bowl History.
Draft Finder
Search through every NFL and AFL draft pick.
Find head-to-head results and also find games matching a particular score.
Posted in Announcement, Features, History, Play Index, Pro-Football-Reference.com, Uncategorized | Comments Off on Dive Into Our Stats with the Play Index This Season
29th August 2014
With football season once again upon us, we figured users that have been away from the sites in the offseason could use a refresher on some changes/updates. We remained hard at work in the offseason rolling out a series of new features & improvements for users to enjoy this season:
- We now have line scores for every game in NFL/AAFC history all the way back to the 1920 APFA (as the NFL was known at the time).
- Thanks to these line scores, we've been able to flesh out stadium histories, as well. We now have an index of every stadium in league history, with leaderboards for venues since 1960. We have also integrated these stadiums into the Player Game Finder and Team Game Finder. So you can now search for the most rushing yards in a game at Lambeau Field since 1960 and the most points scored in a game at Lambeau. This addition has also allowed us to make the Player Touchdown Finder searchable for every season in NFL history.
- We've also enhanced our coverage of more recent history. Our Game Play Finder now allows you to create custom searches through every play since 1998. We now have over 725,000 plays searchable through this tool, including every pass play in Peyton Manning's career.
- Many of you likely noticed that we added the Player Streak Finder late last season. This tool allowed for searches like most consecutive 100-yard rushing games since 1960 and most consecutive seasons with 1,000 receiving yards. Well, we've now rolled out a similar tool for teams, the Team Streak Finder. With this feature, you can find the longest regular-season win streaks since 1940 and the most consecutive 10-win seasons since the merger.
- Wondering how your favorite (or least favorite?) head coach has fared on challenges? You can now find a list of challenges and results on the bottom of coaching pages.
- We have also added trades since 2000 to team pages and player pages (at the bottom).
- Finally, we have added high schools to players' biographical info, creating listings for high schools in the process. If you see any bugs in this data, please let us know.
We hope everyone finds these new features useful this season.
Posted in Announcement, Data, Features, Pro-Football-Reference.com, Uncategorized | 15 Comments »
15th August 2014
We've added play-by-play data for the entire 1998 season to the play finder play index tool, another 41,000+ plays worth of data (bringing us up to over 725,000 total plays, including every play from every Super Bowl). Data-wise, this means we have Peyton Manning's entire career covered (as well as Ryan Leaf's if that's what you're into). All plays (and expected points, pass targets, and tackles) should now show up on 1998 boxscores as well.
Posted in Announcement, Pro-Football-Reference.com | 1 Comment »


We're Social...for Statheads
Every Sports Reference Social Media Account
Site Last Updated: Friday, May 1, 2:56PM
Question, Comment, Feedback, or Correction?
Subscribe to our Free Email Newsletter
Do you have a sports website? Or write about sports? We have tools and resources that can help you use sports data. Find out more.