Sports Reference Blog

Archive for the 'Playoffs' Category

How Are the Warriors Staying Afloat Without Stephen Curry?

5th May 2016

The Golden State Warriors' driverless UberX hit its first real speed bump of the season when Stephen Curry sprained his MCL halfway through Game 4 of the 2016 NBA Playoffs. Without the presumptive NBA MVP, the hyperdrive engine that powers one of the best offenses in NBA history, it was only natural to assume the Warriors would take a step back.

Of course, that's also assuming this Warriors team is mortal. Since the start of the 2nd half of Game 4, when they lost Curry to the knee injury, the Warriors have outscored their opponents by a total of 81 points. The team's eFG% of .542 is below its regular season mark of .563, but a number that still would have been the best in the NBA this year. Read the rest of this entry

Posted in Announcement, Basketball-Reference.com, Playoffs | Comments Off on How Are the Warriors Staying Afloat Without Stephen Curry?

Kobe Bryant Has Always Had Fascinating Goodbyes

13th April 2016

As Kobe Bean Bryant bids farewell to the NBA, you'll likely hear a lot about all of the great accomplishments during his Hall of Fame career. The buzzer beaters, the 81-point game, the rings, the All-NBA teams, the All-Defense teams, the MVP votes. His great achievements literally go on and on. It's why most consider him one of the greatest guards in the history of the game. These accomplishments should be acknowledged, and chances are you've been hearing about them a lot this week.

However, as Kobe says goodbye tonight, I wanted to look at a part of his legacy that has always fascinated me: the way that he has said goodbye in past seasons. Bryant is considered by many to be one of the all-time great postseason performers. The reasons are obvious: He has five rings and two NBA Finals MVPs. He's the third-leading scorer in NBA Postseason history. However, the ultimate test of a superstar player is how they perform with their back against the wall. So I decided to examine Bryant's performance when facing playoff elimination. I did the same for some players with whom he's often compared: Michael Jordan & LeBron James.

First, let me be explicit: By "facing elimination" I mean any playoff game in which a loss would mean the end of his team's season. So these are games in which his team entered with two losses in a best-of-5 series or three losses in a best-of-7 series.

It turns out Bryant faced elimination 19 times in his career. The table below shows his statistics in these 19 games, with links to the box scores for each (by clicking the date). You'll notice that, coincidentally, the first two elimination games of the Black Mamba's career were against the Jazz (the same team he will finish his career against tonight).

Date Tm Opp MP FG FGA 3P 3PA FT FTA TRB AST STL BLK TOV PTS GmSc
1997-05-12 LAL UTA L 29 4 14 0 6 3 3 2 2 1 0 1 11 3.6
1998-05-24 LAL UTA L 19 2 2 0 0 2 3 1 0 1 1 3 6 2.8
1999-05-23 LAL SAS L 40 7 16 1 3 1 2 8 3 0 0 3 16 7.5
2000-05-05 LAL SAC W 34 7 16 1 5 2 2 2 6 0 3 1 17 13.7
2000-06-04 LAL POR W 47 9 19 1 4 6 12 11 7 0 4 2 25 20.3
2002-05-31 LAL SAC W 44 10 20 0 0 11 11 11 5 0 0 1 31 26.4
2002-06-02 LAL SAC W 52 10 26 2 3 8 10 10 7 2 0 0 30 24.1
2003-05-15 LAL SAS L 43 9 19 2 5 0 2 2 6 1 0 7 20 6.7
2004-06-15 LAL DET L 45 7 21 0 2 10 11 3 4 1 0 3 24 13.0
2006-05-06 LAL PHO L 43 8 16 4 8 4 5 4 1 0 1 3 24 13.6
2007-05-02 LAL PHO L 46 13 33 2 8 6 7 4 1 1 0 6 34 11.8
2008-06-15 LAL BOS W 44 8 21 4 9 5 7 7 4 5 0 6 25 16.2
2008-06-17 LAL BOS L 43 7 22 3 9 5 5 3 1 1 0 4 22 8.0
2009-05-17 LAL HOU W 33 4 12 1 4 5 6 7 5 3 2 1 14 14.6
2010-06-15 LAL BOS W 40 9 19 1 4 7 7 11 3 4 0 2 26 24.1
2010-06-17 LAL BOS W 45 6 24 0 6 11 15 15 2 1 0 4 23 9.9
2011-05-08 LAL DAL L 37 7 18 0 5 3 4 3 1 0 0 5 17 3.4
2012-05-12 LAL DEN W 45 7 16 2 2 1 4 1 8 0 1 3 17 10.6
2012-05-21 LAL OKC L 41 18 33 1 6 5 7 5 0 2 0 2 42 25.6
Provided by Basketball-Reference.com: View Original Table
Generated 4/12/2016.

It should be noted that in 1997 and 1998, Bryant was a teenager coming off the bench for the Lakers and did not always see consistent minutes. LeBron and MJ were never in the playoffs as teens, so it's probably unfair to include those years in any comparison. That said, here's Vino's averages in the 17 elimination games he played after becoming a starter. We've also listed the averages for Jordan and James in such games (and have even thrown in Allen Iverson, as a control of sorts, for those who think MJ & LeBron set an impossible standard):

Screen Shot 2016-04-13 at 11.07.22 AM

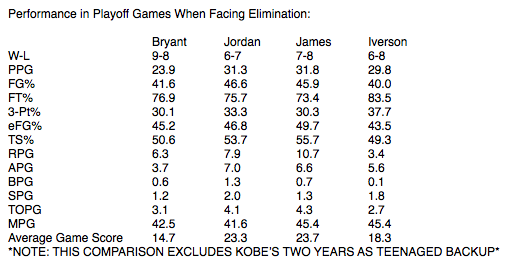
The first thing you'll note is that Bryant is the only of the four to have a winning record in these games (though that record falls to 9-10 if you include losses to the Jazz in his first two seasons). However, you'll notice his personal statistics are a cut below the other players on the list, especially Jordan and James. Of the four, Bryant ranks last a scorer, 2nd-worst in shooting efficiency, 2nd-worst in rebounding, and last in assists. Add it all up and Bryant's average Game Score when facing elimination is 14.7. Game Score was created by John Hollinger to give a rough estimate of a player's productivity for a single game. The scale is similar to that of points scored, so 40 is an outstanding performance and 10 is average. Needless to say, a 14.7 average Game Score in contests of this level of import is very pedestrian for a player of Kobe's standing. For further perspective, Bryant's average Game Score for his entire career is 17.4.

Michael Jordan, meanwhile, was predictably outstanding in these games as he averaged about 31 PPG, 8 RPG and 7 APG, with efficient shooting numbers. His Game Score average of 23.3 crushes Bryant's 14.7. LeBron James, contrary to his reputation, has even better numbers than Jordan in these games, ranking as the best scorer, rebounder and shooter of the group. His average Game Score of 23.7 is also the best. Allen Iverson, meanwhile, put up big scoring and assists numbers, but was the least efficient shooter of the group (though his TS% is close to Kobe's). Still, Iverson's 18.3 Game Score average puts him well ahead of Bryant.

In addition to the relative lack of individual success, the other striking thing about Bryant in these games is the magnitude of several of the losses. It's absolutely incredible that a player on so many great teams was also a part of so many season-ending meltdowns. Let's review:

If you're counting at home, that's four losses by 28+ points when facing playoff elimination. Does Kobe have one more dramatic ending in store for us?

Attached below are tables showing the elimination games of the other players mentioned in this post.

MICHAEL JORDAN IN ELIMINATION GAMES
Date Tm Opp MP FG FGA 3P 3PA FT FTA TRB AST STL BLK TOV PTS GmSc
1985-04-24 CHI MIL W 42 12 26 0 1 11 16 8 7 4 1 3 35 28.2
1985-04-26 CHI MIL L 42 6 16 0 2 17 20 7 5 2 3 4 29 24.3
1986-04-22 CHI BOS L 39 8 18 1 1 2 3 10 9 2 1 5 19 15.4
1987-04-28 CHI BOS L 39 9 30 0 1 12 14 11 7 2 1 2 30 21.5
1988-05-08 CHI CLE W 43 12 22 0 0 15 18 4 6 2 2 7 39 27.8
1988-05-18 CHI DET L 43 10 22 1 2 4 7 8 8 2 0 3 25 18.6
1989-05-07 CHI CLE W 44 17 32 1 1 9 13 9 6 1 0 2 44 32.7
1989-06-02 CHI DET L 42 13 26 1 2 5 12 4 13 3 2 8 32 20.9
1990-06-01 CHI DET W 39 11 20 1 4 6 6 10 2 1 0 3 29 20.6
1990-06-03 CHI DET L 45 13 27 0 2 5 5 8 9 1 0 4 31 23.0
1992-05-17 CHI NYK W 42 15 29 0 0 12 13 6 4 2 3 5 42 31.0
1995-05-18 CHI ORL L 39 8 19 1 2 7 10 9 7 4 4 6 24 19.9
1998-05-31 CHI IND W 42 9 25 0 0 10 15 9 8 0 0 2 28 19.2
Provided by Basketball-Reference.com: View Original Table
Generated 4/12/2016.
LeBRON JAMES IN ELIMINATION GAMES
Date Tm Opp MP FG FGA 3P 3PA FT FTA TRB AST STL BLK TOV PTS GmSc
2006-05-21 CLE DET L 47 11 24 0 4 5 8 8 2 1 0 3 27 15.6
2007-06-14 CLE SAS L 46 10 30 2 7 2 6 6 10 0 0 6 24 7.8
2008-05-16 CLE BOS W 47 9 23 1 3 13 15 12 6 2 1 8 32 21.6
2008-05-18 CLE BOS L 47 14 29 3 11 14 19 5 6 2 0 2 45 32.8
2009-05-28 CLE ORL W 46 11 24 0 2 15 19 14 12 1 1 4 37 33.3
2009-05-30 CLE ORL L 45 8 20 2 8 7 11 7 7 0 1 3 25 16.1
2010-05-13 CLE BOS L 46 8 21 2 4 9 12 19 10 3 1 9 27 22.1
2011-06-12 MIA DAL L 40 9 15 2 5 1 4 4 6 1 1 6 21 13.6
2012-06-07 MIA BOS W 45 19 26 2 4 5 9 15 5 0 0 4 45 36.4
2012-06-09 MIA BOS W 48 9 21 1 5 12 17 12 2 1 1 3 31 22.4
2013-06-03 MIA IND W 41 8 17 1 2 15 16 8 4 2 1 2 32 29.2
2013-06-18 MIA SAS W 50 11 26 1 5 9 12 10 11 3 1 6 32 25.8
2013-06-20 MIA SAS W 45 12 23 5 10 8 8 12 4 2 0 2 37 32.5
2014-06-15 MIA SAS L 41 10 21 3 9 8 9 10 5 0 2 1 31 26.8
2015-06-16 CLE GSW L 47 13 33 2 10 4 8 18 9 2 0 6 32 20.2
Provided by Basketball-Reference.com: View Original Table
Generated 4/12/2016.
ALLEN IVERSON IN ELIMINATION GAMES
Date Tm Opp MP FG FGA 3P 3PA FT FTA TRB AST STL BLK TOV PTS GmSc
1999-05-23 PHI IND L 45 11 28 2 6 1 1 3 6 0 0 2 25 12.5
2000-05-13 PHI IND W 45 7 26 1 4 4 6 3 5 2 0 3 19 6.2
2000-05-15 PHI IND W 46 12 29 2 4 11 12 5 1 1 0 1 37 22.5
2000-05-19 PHI IND L 44 7 20 1 4 3 5 5 3 2 0 2 18 10.0
2001-05-20 PHI TOR W 48 8 27 1 3 4 4 4 16 2 1 4 21 16.0
2001-06-03 PHI MIL W 44 17 33 4 6 6 7 6 7 2 0 2 44 32.8
2001-06-15 PHI LAL L 45 14 32 3 11 6 8 3 2 2 0 3 37 18.7
2002-04-28 PHI BOS W 44 10 23 3 5 19 20 5 4 5 0 3 42 34.6
2002-05-01 PHI BOS W 42 9 26 1 5 9 10 5 4 4 0 4 28 16.9
2002-05-03 PHI BOS L 44 11 24 4 7 5 8 2 4 1 0 1 31 20.4
2003-05-16 PHI DET L 53 14 33 1 1 9 10 3 9 2 1 5 38 24.2
2005-05-03 PHI DET L 48 14 30 1 5 5 6 1 7 0 0 4 34 18.2
2007-05-02 DEN SAS L 44 6 22 2 5 7 9 0 8 2 0 3 21 11.8
2008-04-28 DEN LAL L 43 10 22 0 3 2 3 2 2 0 0 1 22 11.6
Provided by Basketball-Reference.com: View Original Table
Generated 4/13/2016.

Posted in Announcement, Basketball-Reference.com, Data, History, Playoffs, Uncategorized | Comments Off on Kobe Bryant Has Always Had Fascinating Goodbyes

2016 Stanley Cup Playoffs Statistics

13th April 2016

With playoffs season upon us, we wanted to point out our 2016 NHL Stanley Cup Playoffs section. While it's mostly a shell right now, it will be a good bookmark for info as the playoffs get going. You can find a schedule & results for every game, stats for every skater, goalie & team, as well as leaderboards.

There are also series preview pages to see how opponents match up with each other.

If you're more of a history buff, you can also take a skate down memory lane by checking out past playoff seasons, such as 2015 or 1987. Stats for series are also available, such as the 2013 Stanley Cup Final. Links to all playoff seasons (and a list of champions, runners-up and Conn Smythe winners) are available here.

Other Stanley Cup Playoff resources include our all-time Leaders & Records section, list of frequent champions and our Player Season Finder tool. With the Player Season Finder, you can run restrict your searches to playoff games and run all sorts of custom queries such as leading goal scorers, assists leaders, short-handed goal leaders and many others.

Our Team Game Finder & Player Game Finder also contain options to restrict your searches to playoff games only. You can search for things such as the most recent playoff hat tricks & team records in their playoff openers. You can also run searches for things like worst playoff opening loss by the eventual Stanley Cup champ. For player game searches, it should be noted that our player game logs currently go back to the 1988 Playoffs.

We also have historical sections for Stanley Cup Playoff Comebacks, a game-by-game breakdown of every possible scenario in a 7-game playoff series and every overtime goal in Stanley Cup Playoffs history.

We hope you enjoy these features and please let us know what you'd like to see in the future.

Posted in Announcement, Data, History, Hockey-Reference.com, Playoffs, Uncategorized | Comments Off on 2016 Stanley Cup Playoffs Statistics

Week 16 NFL Playoff Scenarios

23rd December 2015

PER NFL COMMUNICATIONS:

2015 NFL PLAYOFF SCENARIOS FOR WEEK 16

AFC

CLINCHED: New England – AFC East and a first-round bye

Cincinnati – playoff berth

Posted in Announcement, Data, Playoffs, Pro-Football-Reference.com | Comments Off on Week 16 NFL Playoff Scenarios

Full Box Scores Added for 1983 & 1984 NBA Playoffs

10th December 2015

Thanks to the research of Sean Burrill, we're happy to announce that we now have complete box scores for the 1984 NBA Playoffs, and mostly complete box scores for the 1983 NBA Playoffs. Previously, these box scores were mostly restricted to player scoring and shooting statistics.

Additionally, 1984 Playoff games are now searchable in the Play Index. For instance, here's a list of triple-doubles in the 1984 Playoffs and most 3-pointers made by a team in 1984 Playoff games.

1983 Playoff box scores are also updated, but not searchable in the Play Index because we're missing some statistics from these games (please contact us if you are able to fill in any of these gaps):

Game 2, Boston at Atlanta: three-point attempts, offensive rebounding, turnovers, steals

Game 2, Milwaukee at Boston: offensive rebounding

Game 2, Portland at Los Angeles: offensive rebounding

Game 3, Los Angeles at Portland: offensive rebounding

Game 3, San Antonio at Denver: offensive rebounding

Game 3, Los Angeles at San Antonio: offensive rebounding

Game 5, San Antonio at Los Angeles: offensive rebounding, turnovers

Game 6, Los Angeles at San Antonio: offensive rebounding, turnovers

Posted in Announcement, Basketball-Reference.com, Data, History, Play Index, Playoffs | 1 Comment »

Find NBA Finals Data on Basketball-Reference

4th June 2015

With the NBA Finals (finally) tipping off tonight, we just wanted to quickly link to some of the NBA Finals data & tools we have on the site.

  • For a full list of NBA Champions, Finals MVPs & annual top playoff performers click here.
  • For greater detail on the performance of Finals MVPs, check out this list. LeBron James is 1 of just 10 players with multiple NBA Finals MVPs. Only Jordan, Duncan, Magic & Shaq have more than 2.
  • For a full list of every Playoff series in NBA history click here. You can also click on any series on that list to see a cumulative box score for that series, with links to every game. Here is the 2014 NBA Finals, for instance.
  • If counting "ringz" is your thing, check out our list of the players with the most championships. As you can see, LeBron James has a chance to match another all-time great SF, Larry Bird, with 3 titles.
  • Additionally, you can use our Play Index to run searches specifically for NBA Finals games. In the Team Game Finder or Player Game Finder, just set the game type filter to Playoffs and the round filter to Finals like in the image:

NBA Finals search


We hope you find these tools useful as you enjoy the 2015 NBA Finals.

Posted in Announcement, Basketball-Reference.com, Data, Features, History, Play Index, Playoffs | 3 Comments »

Historical Data on Best-of-7 Series Added to Hockey Reference

28th May 2015

We're excited to introduce a new resource for our users to enjoy during the Stanley Cup Playoffs. This new feature contains a game-by-game breakdown of how teams in any given situation fare in Best-of-7 series.

The page consists of a series of tables. The first one shows the home team's record in any given game of a series:

Screen Shot 2015-05-28 at 4.05.37 PM

Regular games & overtime games are self explanatory. Closeout games cover any game in which a team has a chance to clinch the series. Elimination games are games in which a team is facing elimination. All Game 7s are both closeout games & elimination games, so we have zeroed out those rows.

The second table is a little more complicated, but features some really cool information once you get acquainted with how to read it. Using this table, you can see how a team's historical odds of winning a given series change with each passing game. For instance, road teams that win Game 6 to tie a series at 3-3, have gone 34-23 in Game 7. Teams that take a 2-0 series lead go on to win the series 87.0% of the time, etc. This table contains the history of every position a team could be in in a Best-of-7 series.

Beneath that behemoth of a table is a simple table with every franchise's record in Best-of-7 series. It's sortable, so you can see that the Canadiens have won the most series and that the Oilers have the best series win percentage.

Finally, the fourth table features every franchise's record in the all-important seventh game. The data is broken down into overall record, home record and away record. Of particular note, with a home Game 7 looming for the Rangers, is that their 7-0 record is home Game 7s is the best in NHL history. You'll also notice that the accompanying winning percentages contain hyperlinks. If you click on those links, they will bring you Play Index query results listing each of those games. So you can easily see all 7 of those Rangers home Game 7s, and then click through to the box scores, as well.

We also wanted to give quick mention to a few other recent additions, in case you missed them:

All-time comebacks from down 3-0 or 3-1

Every Overtime Goal in NHL Stanley Cup Playoffs history

We hope you all can enjoy this new feature as much as we already are at the office. And enjoy what's left of the 2015 Stanley Cup Playoffs.


Posted in Announcement, Data, Features, History, Hockey-Reference.com, Playoffs | 1 Comment »

Stanley Cup Playoffs Comebacks Added

20th May 2015

We just wanted to quickly point out that we have added a new Frivolity to the site: Teams to win a Best-of-7 series after trailing 3-0 or 3-1. The Rangers recent comeback against the Capitals got us thinking about this, so we figured we'd add the list. Please stay tuned for more cool Best-of-7 series features like this in the feature.

Posted in Announcement, Data, History, Hockey-Reference.com, Playoffs | 3 Comments »

Every OT Goal in Stanley Cup Playoffs History

20th April 2015

We just wanted to briefly mention that we have recently added every overtime goal in the history of the Stanley Cup Playoffs to our Frivolities section here. This section currently contains two tables. The first shows the goal scorer, date, team, opponent, OT sessions, final score and how much time had elapsed in the OT periods at the time of the goal. The columns in the table are all sortable in case you'd like to quickly look at OT goals scored for or against your favorite team or find the shortest/longest OT games.

The table on the right, meanwhile, lists the all-time individual leaders in playoff OT goals.

It should be mentioned that this is a comprehensive list of OT goals in Stanley Cup Playoff games between two NHL teams. It does not, however, include games featuring the NHL against the WCHL or PCHA. You may also notice a couple instances where the "winning" OT goal merely tied the game. This is because some early playoff series were determined by total goals, so a game a team held a lead in could go to OT in order to determine the series winner.

Posted in Announcement, Data, Features, History, Hockey-Reference.com, Playoffs | Comments Off on Every OT Goal in Stanley Cup Playoffs History

2015 Stanley Cup Playoffs Section

15th April 2015

With playoffs season upon, we wanted to point out our 2015 NHL Stanley Cup Playoffs section. While it's mostly a shell right now, it will be a good bookmark for info as the playoffs get going. You can find schedule & results for every game, stats for every skater, goalie & team, as well as leaderboards.

There are also series preview pages to see how opponents match up with each other.

If you're more of a history buff, you can also take a skate down memory lane by checking out past playoff seasons, such as 2014 or 2013. Stats for series are also available, such as the 2013 Stanley Cup Final. Links to all playoff seasons (and a list of champions, runners-up and Conn Smythe winners) are available here.

Other Stanley Cup Playoff resources include our all-time Leaders & Records section, list of frequent champions and our Player Playoff Finder tool. With the Player Playoff Finder, you can run all sorts of custom queries such as leading goal scorers, assists leaders, short-handed goal leaders and many others.

Our Team Game Finder & Player Game Finder also contain options to restrict your searches to playoff games only. You can search for things such as the most recent playoff hat tricks & team records in their playoff openers. It should be noted that our player game logs currently go back to the 1988 Playoffs.

We hope you enjoy these features and please let us know what you'd like to see in the future.

Posted in Announcement, Features, History, Hockey-Reference.com, Play Index, Playoffs | Comments Off on 2015 Stanley Cup Playoffs Section