3rd March 2015
One of the more common subjects for queries we receive at Sports-Reference is our SRS (Simple Rating System) figures. For some background, the first of our sites to add SRS was Pro-Football-Reference, when Doug Drinen added it to the site in 2006 and provided this excellent primer. The important thing to know is that SRS is a rating that takes into account average point differential and strength of schedule. For instance, the 2006-07 Spurs won games by an average of 8.43 points per game and played a schedule with opponents that were 0.08 points worse than average, giving them an SRS of 8.35. This means they were 8.35 points better than an average team. An average team would have an SRS of 0.0. The calculation can be complicated, but the premise is simple and it produces easily interpreted results.
However, there are some variations in the way we calculate SRS across our various sites. We'll break down these differences below.
Pro-Football-Reference.com SRS: PFR's SRS is unique in that a home-field advantage is included as a part of the calculation because of the short schedule compared to the other sports (we don't want a team to look relatively weak at the halfway point because they've only played 3 of their first 8 at home, for instance). This HFA fluctuates yearly based on game results, but it is generally somewhere between 2 and 3 points (2006 being an outlier, as you'll see). Below is a look at the HFA numbers we have used since 2001. If you'd like to calculate these HFAs yourself, just sum up every team's home point differential and then divide by the total number of games played across the league that season. This data can easily be found in the Play Index for each season:
- 2001: 2.0081
- 2002: 2.2461
- 2003: 3.5547
- 2004: 2.5078
- 2005: 3.6484
- 2006: 0.8477
- 2007: 2.8672
- 2008: 2.5586
- 2009: 2.2070
- 2010: 1.8945
- 2011: 3.2656
- 2012: 2.4336
- 2013: 3.1055
- 2014: 2.4883
College Football SRS: Our CFB SRS does not contain a home-field advantage element, but it does have some other quirks. Most importantly, we have capped the margin of victory considered for the formula. Due to the number of mismatches seen in college football, the maximum point differential a team can be credited with in a game is 24. We also credit all wins as a minimum of plus-7 margin of victory (so if you win by 1 point, it's treated the same as a 7-point win). The same logic is applied to losses, as well. One other wrinkle for CFB is that all non-major opponents are included as one team for the sake of the ratings.
College Basketball SRS: SRS for college hoops is straight forward (no HFA & no adjusted MOV), but one item to note is that games against non-major opponents are not counted in our calculations.
MLB, NBA & NHL: All of these SRS calculations are straight forward with no adjustments for HFA and no capping of MOV. It should be noted, however, that no special consideration is given for extra-innings, overtimes or shootouts, either.
We'll close with a quick rundown of the various merits and weaknesses of SRS, from Drinen's original 2006 post. These bullet points were created to describe the system used for NFL SRS, but many of the strengths and weaknesses can applied to the other sports, as well:
- The numbers it spits out are easy to interpret - if Team A's rating is 3 bigger than Team B's, this means that the system thinks Team A is 3 points better than Team B. With most ranking algorithms, the numbers that come out have no real meaning that can be translated into an English sentence. With this system, the units are easy to understand.
- It is a predictive system rather than a retrodictive system - this is a very important distinction. You can use these ratings to answer the question: which team is stronger? I.e. which team is more likely to win a game tomorrow? Or you can use them to answer the question: which of these teams accomplished more in the past? Some systems answer the first questions more accurately; they are called predictive systems. Others answer the latter question more accurately; they are called retrodictive systems. As it turns out, this is a pretty good predictive system. For the reasons described below, it is not a good retrodictive system.
- It weights all games equally - every football fan knows that the Colts' week 17 game against Arizona was a meaningless exhibition, but the algorithm gives it the same weight as all the rest of the games.
- It weights all points equally, and therefore ignores wins and losses - take a look at the Colts season. If you take away 10 points in week 3 and give them back 10 points in week 4, you've just changed their record, but you haven't changed their rating at all. If you take away 10 points in week 3 and give back 20 points in week 4, you have made their record worse but their rating better. Most football fans put a high premium on the few points that move you from a 3-point loss to a 3-point win and almost no weight on the many points that move you from a 20-point win to a 50-point win.
- It is easily impressed by blowout victories - this system thinks a 50-point win and a 10-point loss is preferable to two 14-point wins. Most fans would disagree with that assessment.
- It is slightly biased toward offensive-minded teams - because it considers point margins instead of point ratios, it treats a 50-30 win as more impressive than a 17-0 win. Again, this is an assessment that most fans would disagree with.
- This should go without saying, but - I'll say it anyway. The system does not take into account injuries, weather conditions, yardage gained, the importance of the game, whether it was a Monday Night game or not, whether the quarterback's grandmother was sick, or anything else besides points scored and points allowed.
Posted in Announcement, Baseball-Reference.com, Basketball-Reference.com, CBB at Sports Reference, CFB at Sports Reference, Data, FAQ, Features, Hockey-Reference.com, Pro-Football-Reference.com, SRS, Stat Questions, Statgeekery, Uncategorized | 2 Comments »
5th February 2015
We are happy to announce that we have added Cuban National Series statistics from 1997-98 to 2013-14 thanks to the efforts of Brian Cartwright. First thing's first, though. You should go ahead and gawk at Jose Abreu's Cuban stats. That's right, he hit .453 in 2010 with 1.583 OPS. Those both led the league, but his 33 HR merely tied Yoenis Cespedes for first.
These statistics can be navigated to via our Minor Leagues section here. Once in the minors section, look for Foreign leagues and select Cuban National Series. You can select a season and access batting leaders & pitching leaders from there.
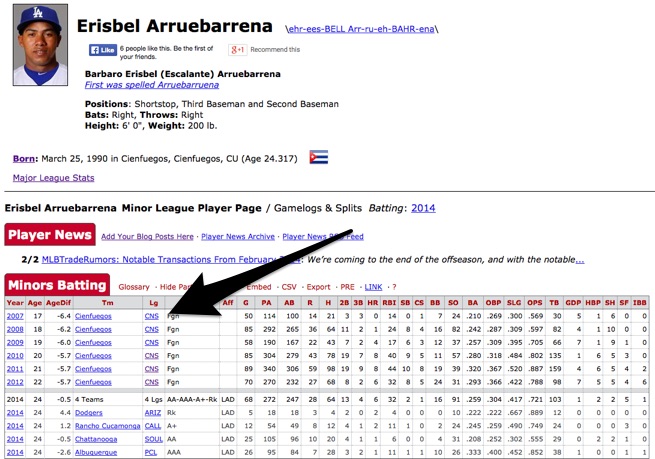
Alternately, if you just want to find Cuban stats for an MLB player like Yasiel Puig, just go to the Minors tab from his player page. Or you can use the search form to go right to the page of a hot prospect like Yoan Moncada. On a player's minor league stats page, the Cuban statistics will show up with the league abbreviation CNS like in the image of Erisbel Arruebarrena's page below.
We hope you enjoy this new feature. We would also like to note that we will be adding statistics from the current season once is it completed.
Posted in Announcement, Baseball-Reference.com, Data, Features | 5 Comments »
23rd January 2015
If you haven't seen the Super Bowl Section of our site yet, you should head over and check it out right now, because we think it's pretty awesome. Here are some of the features you'll find once you get there:
And best of all is the Super Bowl Play Finder tool. It's similar to the Play Index Game Play Finder tool, but limits your searches strictly to Super Bowls and allows you to search through every play of all 48 previous games. Some examples:
Our Player Game Finder and Team Game Finder are also unique tools for Super Bowl research. You can use them to find things like every 100-yard rusher in Super Bowl history, the largest point spreads in Super Bowl history or the highest over/unders. You can also identify trends such as the record of the team leading after one quarter (26-11), at halftime (36-10) and through three quarters of play (39-8).
So go ahead and try the Super Bowl Section right now -- it's free, easy to use, and best of all, with it you'll be able to dominate anyone who challenges you in Super Bowl trivia.
UPDATE: We have also added a Super Bowl filter to our Drive Finder, which allows users to find things such as the longest drives in any Super Bowl since 1998 or the fastest Super Bowl touchdown drives since 1998.
Posted in Announcement, Data, Features, History, Play Index, Playoffs, Pro-Football-Reference.com, Super Bowl, Uncategorized | 1 Comment »
9th January 2015
Just wanted to quickly note that we have added Punts, Punting Yards & Yards per Punt to the Team Game Finder in the Play Index. The data is complete back to 1950, but is spotty before that. We apologize to Doug Drinen for adding more punting stats, but encourage users to enjoy the new queries.
Posted in Announcement, Features, Play Index, Pro-Football-Reference.com, Uncategorized | Comments Off on Punt Statistics Added to Team Game Finder
22nd December 2014
The holiday travel season is a time when many of us revisit our roots and return to our hometowns and home states. With that in mind, we thought now would be a good time to remind folks of a data-rich, but perhaps rarely seen portion of our site: Bio Data
This corner of baseball-reference features various totals by place of birth, place of death and place of burial.
For instance, it's probably no surprise that California leads all states with 47,958 home runs (more than 3 times more than any other state). But did you know that the 28 players born in New Mexico have the best cumulative OPS? Or that managers born in Florida are the most games over .500?
You can also compare various statistics across birth countries.
And our most recent addition is the ability to sort by age at time of death. Virgil Trucks, for instance, was the oldest former player to pass in the state of Alabama.
There's a lot of interesting data to play around with in this section. Next time your team hires a manager, perhaps they should look in the United Kingdom and avoid Australia, for instance. And, above all else, never scout for pitching help in North Dakota.
Happy Holidays, from Sports Reference.
Posted in Announcement, Baseball-Reference.com, Data, Features, History | Comments Off on Browse our Biographical Data
27th October 2014
As you may have noticed, we recently added the ability to compare different stat categories in our Team Game Finder. We're happy to announce that we've now brought the same function to our Player Game Finder.
So you can now search for things like:
Obviously, there's plenty of other queries you can run with this. We encourage you to play around with it and we hope you enjoy it!
Just as a reminder, if you do not want to answer survey questions on the Play Index, we offer ad-free subscriptions good on all Sports Reference sites for a little over a nickel per day ($20/year).
Posted in Announcement, Data, Features, Play Index, Pro-Football-Reference.com | 4 Comments »
14th October 2014
Ever wanted to see every touchdown scored and allowed by a team in a season in an easy, sortable table? If you answered "yes", you're in luck. Today we've rolled out those tables on team pages for every team in APFA/NFL history. So you can now find such a table for the 1920 Decatur Staleys & also for the 2014 Philadelphia Eagles. These tables can be found at the bottom the main page for each team.
And don't forget that even larger tables can be generated via our Player Touchdown Finder in the Play Index.
Posted in Announcement, Data, Features, Pro-Football-Reference.com | Comments Off on Team & Opponent TD Logs Added to Team Pages
9th October 2014
We've recently added a few cool features to the Team Game Finder that we wanted to update everyone on.
The first addition was inspired by the slew of return TDs scored by the Eagles in the first 5 weeks of this season. It sure seemed extreme, but we had no way of placing it into perspective via the Play Index. Well, now we do. We've added a function to search for all Return TDs (any TD that is not passing or rushing). It turns out, the Eagles are the only team since 1940 to score 7+ Return TDs in their first 5 games. The 1998 Seahawks had 13 such scores, the most in a season since 1940.
We have also added penalty & penalty yards data to the game finder. I'm sure our users won't be shocked to discover that the Raiders have 6 of the 8 most penalized teams since the merger. And the 1998 49ers had the most penalties by any team in a win since the merger, with 22 at Buffalo. Our penalty data is mostly complete back to 1950, but we'd recommend restricting searches to post-merger for the best accuracy.
Posted in Announcement, Data, Features, Play Index, Pro-Football-Reference.com | 1 Comment »
8th October 2014
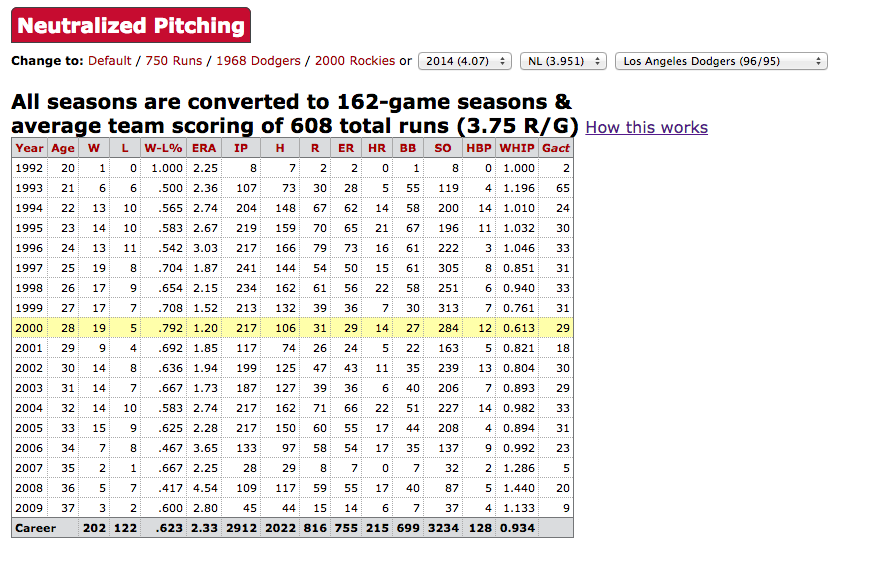
Just a quick announcement that the 2014 season has been added as an option to our Neutralized Stats tables. As a reminder, these tables can be found by clicking on "More Stats" on player pages and then scrolling down to the neutralized section.
This feature allows us to compare players across eras. For instance, the image below shows how each of Pedro Martinez's seasons would have looked if pitching in the environment of the 2014 Dodgers:
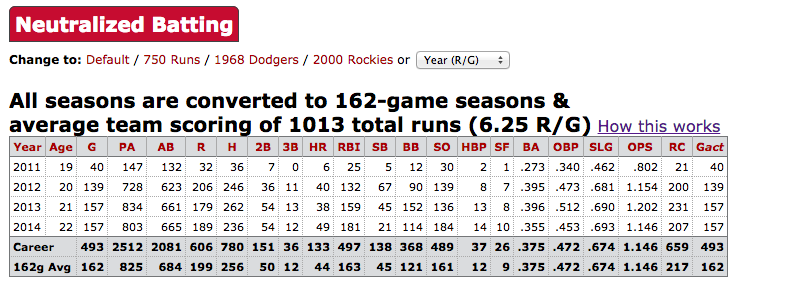
 The same adjustments can be applied to batting numbers, as well. For instance, check out Mike Trout's statistics translated to the batting environment of the 2000 Rockies:
Posted in Announcement, Baseball-Reference.com, Data, Features | 3 Comments »
7th October 2014
Just wanted to post a quick blurb that we have made a few recent additions to the Team Streak Finder:
Posted in Announcement, Data, Features, Play Index, Pro-Football-Reference.com, Uncategorized | 5 Comments »


We're Social...for Statheads
Every Sports Reference Social Media Account
Site Last Updated: Friday, May 1, 2:56PM
Question, Comment, Feedback, or Correction?
Subscribe to our Free Email Newsletter
Do you have a sports website? Or write about sports? We have tools and resources that can help you use sports data. Find out more.