10th April 2015
I am pleased to announce that Hans van Slooten has taken over day-to-day development of Baseball-Reference.com. Hans has been with Sports Reference for 15 months now and moved over from hockey to baseball last month. Hans is a long-time SABR member and a very talented developer. You are likely to see a bunch of improvements this summer with Hans on the site full-time rather than me on the site half-time. He's also a dedicated Twins fan, so he will not face the unneeded distraction of a deep postseason run by his favorite team. Hans is on twitter at @cantpitch.
I'm not going anywhere. I'm still President of Sports Reference and will certainly be involved in Baseball-Reference.com, just not with day-to-day responsibilities. With six full-time employees, I have a bit more a management role now, and we are also launching a new site this summer and expecting to roll out some changes to all of the sites this summer.
Posted in Announcement, Baseball-Reference.com, Statgeekery | 2 Comments »
5th April 2015
It's been a long winter in Philadelphia (and in Minnesota). In honor of Sunday and Monday, the greatest days of the year, here are some Opening Day features we have here at B-R:
Give them a try, and enjoy baseball's return.
Posted in Announcement, Baseball-Reference.com | 3 Comments »
1st April 2015
We have an exciting feature for our users who also happen to be major league ballplayers. The new Baseball-Reference.com TCS® (Tonsorial Consulting Service) can help you decide new directions to take your hair style and/or facial hair without having to take the time to grow the hair first.
Read the rest of this entry
Posted in Announcement, Baseball-Reference.com, expire7d, Features, Statgeekery, Tips and Tricks | 12 Comments »
27th March 2015
We're offering free access to the Baseball-Reference Play Index through April 15. Just sign up here and use this coupon code: Analytics
The Play Index is the most thorough and powerful publicly available baseball research tool. Subscriptions are normally $36/year. Below is a sampling of some of the search tools:
The Batting or Pitching Season Finder. This tool allows you to search full-season or multi-year totals to find your own custom leaderboards. You can look at the entire history of baseball from 1871-2014 with every year, team, and position available, or you can filter the results in a vast number of ways: by specific years, by age, by first six seasons or last ten seasons, by American League only, by Cubs only, by switch-hitters, by catchers, by outfielder or infielder, by year of debut, but active or retired, by Hall of Famer, by height and weight, by living or deceased, or by a range of common statistical categories. Then you can sort the results by any common statistic, by the teams with the most players matching that category, by players with the most seasons matching that category, or by most recent, youngest, oldest, final year, or year of debut, and others.
The Batting or Pitching Game Finder. This tool allows you to search player game totals (think 4 for 5 with 3 RBI, or 10-SO shutouts) filtering on any of a dozen or more choices. This can be done either on a single player level or on any batter from nearly one hundred years or on any pitcher. The same can be done for Team Batting or Team Pitching Totals.
The Batting or Pitching Split Finder. This tool allows you to search player splits (think most road home runs, biggest lefty/righty splits or most hits in Yankee Stadium) filtering on any of a dozen or more choices. This can be done either on a single player level or on any batter from nearly 100 years or on any pitcher. The same can be done for Team Batting or Team Pitching Splits.
The Batting or Pitching Streak Finder. This tool allows you to search player games looking for the most consecutive games matching a particular set of criteria. This can be done either on a single player level or on any batter from nearly sixty years or on any pitcher. The same can be done for Team Batting or Team Pitching Streaks. Note that when searching for batters, you should limit your searches to 20-25 years when searching through all games.
The Batting or Pitching Event Finder. This tool is player specific and will out put a detailed summary and play-by-play list of all events of a specific type from a single year or an entire career. For example, you can see all of Harmon Killebrew's triples or even his outs to the second baseman.
The Batter vs. Pitcher Tool. This tool presents a complete sortable list of batter or pitcher with totals for every opponent they faced by career or by year. Clicking on the player's name will lead you to a detailed output of their head-to-head plate appearances.
Posted in Announcement, Baseball-Reference.com, expire21d, Features, Play Index | 19 Comments »
25th March 2015
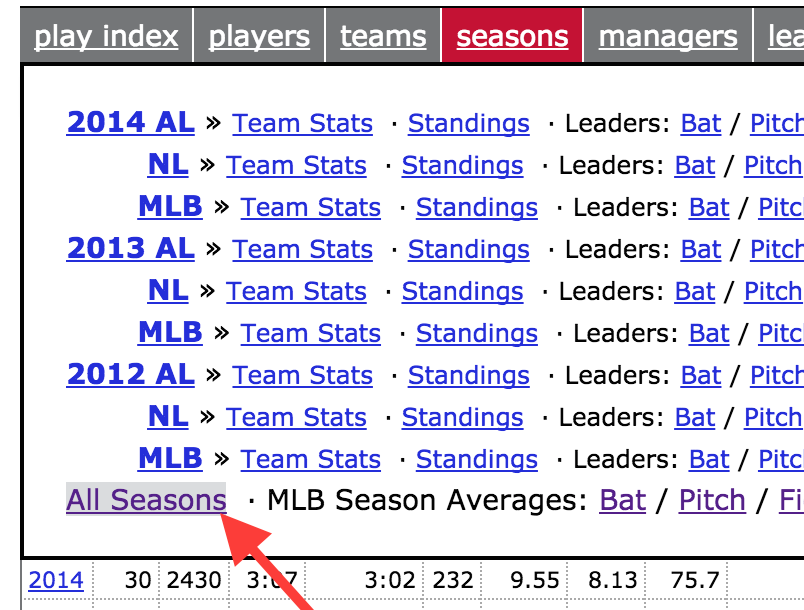
It's been reported in numerous locations, and now we've added an additional page to our League Encyclopedias that confirms it: games have reached scoring lows not seen regularly since the 1960's (8.13 R/G) and are longer, on average, than they have ever been (3 hours and 7 minutes per game in 2014). Additionally, 9-inning games were over three hours long, on average, for the first time in MLB history last year (3 hours and 2 minutes).
This new page also includes historical averages for extra-innings games, pitches/PA, pitchers/game and season, batters/game and season, pinch runners/game, and pinch hitters/game.
To find these pages, click on the menu Seasons > All Seasons, then click on Misc on the right side of the page for any of the leagues.

Posted in Announcement, Baseball-Reference.com, Features | 2 Comments »
17th March 2015
We have added historical snapshots of franchises with the creation of organizational pitching and batting depth charts back to 2010. These pages are accessible from the team's page. For instance, if you wanted to see the 2010 Phillies, first go to their team page. From there, to see the pitching depth chart, hover over "Pitching" on the gray bar and then choose "Org. Depth Chart."

This will then lead you to a page where you can look at a breakdown of the various pitchers (LH starters, RH relievers, etc) throughout different levels of the organization with their stats and levels played at for that season.
The same thing can be done for batting and these pages are available for all franchises back to 2010.
Please note that the formatting on these pages may appear a bit wonky at times, as these are mainly there as historical artifacts.
Posted in Announcement, Baseball-Reference.com, Data, Features, History | Comments Off on Organizational Depth Charts Added Back to 2010
12th March 2015
2015 Spring Training statistics are now up and running on Baseball Reference. You can see all player statistics on one page with our batting register and pitching register. Additionally, spring training stats can be found on top of the Standard Batting table on player pages and on Spring team pages, which can be accessed via the home page.
You may notice that the Opponent Quality column has not yet been filled in, but we're working on that and will have it updated soon.
Posted in Announcement, Baseball-Reference.com, Data | 1 Comment »
6th March 2015
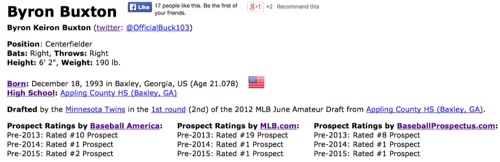
Just wanted to quickly note that we have recently added pre-2015 prospect rankings to minor league player pages. For this purpose, we have used three rankings: Baseball America's Top 100, MLB.com's Top 100 & Baseball Prospectus' Top 101.
These rankings can be found towards the bottom of the biographical section of a player's minor league page. You'll notice that Minnesota's Byron Buxton is the highest-rated prospect for the second straight year:
Posted in Announcement, Baseball-Reference.com, Data | Comments Off on Pre-2015 Top Prospect Rankings Added to MiLB Player Pages
5th March 2015
One of the things I love about SABR is how dedicated (and borderline crazy) some of the researchers are and how their years and years of work can bear fruit in unexpected ways. (I'm sure I love it because I have more than a bit of that in me as well.) In next month's Baseball Research Journal, an article by Herm Krabbenhoft will show that Heinie Zimmerman had the highest RBI total in the 1912 NL, and when paired with his undisputed batting title and 14 home runs, he won the triple crown.
Read the rest of this entry
Posted in Advanced Stats, Announcement, Baseball-Reference.com, Statgeekery | 8 Comments »
3rd March 2015
One of the more common subjects for queries we receive at Sports-Reference is our SRS (Simple Rating System) figures. For some background, the first of our sites to add SRS was Pro-Football-Reference, when Doug Drinen added it to the site in 2006 and provided this excellent primer. The important thing to know is that SRS is a rating that takes into account average point differential and strength of schedule. For instance, the 2006-07 Spurs won games by an average of 8.43 points per game and played a schedule with opponents that were 0.08 points worse than average, giving them an SRS of 8.35. This means they were 8.35 points better than an average team. An average team would have an SRS of 0.0. The calculation can be complicated, but the premise is simple and it produces easily interpreted results.
However, there are some variations in the way we calculate SRS across our various sites. We'll break down these differences below.
Pro-Football-Reference.com SRS: PFR's SRS is unique in that a home-field advantage is included as a part of the calculation because of the short schedule compared to the other sports (we don't want a team to look relatively weak at the halfway point because they've only played 3 of their first 8 at home, for instance). This HFA fluctuates yearly based on game results, but it is generally somewhere between 2 and 3 points (2006 being an outlier, as you'll see). Below is a look at the HFA numbers we have used since 2001. If you'd like to calculate these HFAs yourself, just sum up every team's home point differential and then divide by the total number of games played across the league that season. This data can easily be found in the Play Index for each season:
- 2001: 2.0081
- 2002: 2.2461
- 2003: 3.5547
- 2004: 2.5078
- 2005: 3.6484
- 2006: 0.8477
- 2007: 2.8672
- 2008: 2.5586
- 2009: 2.2070
- 2010: 1.8945
- 2011: 3.2656
- 2012: 2.4336
- 2013: 3.1055
- 2014: 2.4883
College Football SRS: Our CFB SRS does not contain a home-field advantage element, but it does have some other quirks. Most importantly, we have capped the margin of victory considered for the formula. Due to the number of mismatches seen in college football, the maximum point differential a team can be credited with in a game is 24. We also credit all wins as a minimum of plus-7 margin of victory (so if you win by 1 point, it's treated the same as a 7-point win). The same logic is applied to losses, as well. One other wrinkle for CFB is that all non-major opponents are included as one team for the sake of the ratings.
College Basketball SRS: SRS for college hoops is straight forward (no HFA & no adjusted MOV), but one item to note is that games against non-major opponents are not counted in our calculations.
MLB, NBA & NHL: All of these SRS calculations are straight forward with no adjustments for HFA and no capping of MOV. It should be noted, however, that no special consideration is given for extra-innings, overtimes or shootouts, either.
We'll close with a quick rundown of the various merits and weaknesses of SRS, from Drinen's original 2006 post. These bullet points were created to describe the system used for NFL SRS, but many of the strengths and weaknesses can applied to the other sports, as well:
- The numbers it spits out are easy to interpret - if Team A's rating is 3 bigger than Team B's, this means that the system thinks Team A is 3 points better than Team B. With most ranking algorithms, the numbers that come out have no real meaning that can be translated into an English sentence. With this system, the units are easy to understand.
- It is a predictive system rather than a retrodictive system - this is a very important distinction. You can use these ratings to answer the question: which team is stronger? I.e. which team is more likely to win a game tomorrow? Or you can use them to answer the question: which of these teams accomplished more in the past? Some systems answer the first questions more accurately; they are called predictive systems. Others answer the latter question more accurately; they are called retrodictive systems. As it turns out, this is a pretty good predictive system. For the reasons described below, it is not a good retrodictive system.
- It weights all games equally - every football fan knows that the Colts' week 17 game against Arizona was a meaningless exhibition, but the algorithm gives it the same weight as all the rest of the games.
- It weights all points equally, and therefore ignores wins and losses - take a look at the Colts season. If you take away 10 points in week 3 and give them back 10 points in week 4, you've just changed their record, but you haven't changed their rating at all. If you take away 10 points in week 3 and give back 20 points in week 4, you have made their record worse but their rating better. Most football fans put a high premium on the few points that move you from a 3-point loss to a 3-point win and almost no weight on the many points that move you from a 20-point win to a 50-point win.
- It is easily impressed by blowout victories - this system thinks a 50-point win and a 10-point loss is preferable to two 14-point wins. Most fans would disagree with that assessment.
- It is slightly biased toward offensive-minded teams - because it considers point margins instead of point ratios, it treats a 50-30 win as more impressive than a 17-0 win. Again, this is an assessment that most fans would disagree with.
- This should go without saying, but - I'll say it anyway. The system does not take into account injuries, weather conditions, yardage gained, the importance of the game, whether it was a Monday Night game or not, whether the quarterback's grandmother was sick, or anything else besides points scored and points allowed.
Posted in Announcement, Baseball-Reference.com, Basketball-Reference.com, CBB at Sports Reference, CFB at Sports Reference, Data, FAQ, Features, Hockey-Reference.com, Pro-Football-Reference.com, SRS, Stat Questions, Statgeekery, Uncategorized | 2 Comments »


We're Social...for Statheads
Every Sports Reference Social Media Account
Site Last Updated: Friday, May 1, 2:56PM
Question, Comment, Feedback, or Correction?
Subscribe to our Free Email Newsletter
Do you have a sports website? Or write about sports? We have tools and resources that can help you use sports data. Find out more.