Sports Reference Blog

Archive for the 'Advanced Stats' Category

Advanced Hockey Stats on Hockey Reference

18th January 2016

If you're among the NHL fans lamenting the upcoming shuttering of War on Ice, we just wanted to remind you of the variety of advanced hockey stats we offer on Hockey Reference. While we're perhaps best known as a repository for historical statistics, we have beefed up our analytics in the last few years. In fact, if you click here, you can conveniently see a menu of our analytics offerings. These include:

Posted in Advanced Stats, Announcement, Data, Hockey-Reference.com, Play Index, Statgeekery | Comments Off on Advanced Hockey Stats on Hockey Reference

LeBron Passes Jordan to Become All-Time VORP King

15th January 2016

LeBron James has moved his career VORP total to 104.46 and now narrowly leads Michael Jordan's 104.44 for most in NBA history. It should be noted that VORP can only be calculated since 1973-74, so Wilt Chamberlain's career is not included (nor are the first four seasons of Kareem Abdul-Jabbar's career). VORP was created by Daniel Myers, in conjunction with Box Plus/Minus. Descriptions of the statistics and how they are calculated can be found here.

A comparison of some of their career regular-season advanced statistics can be seen below:

Player G MP TS% TRB% AST% STL% BLK% TOV% USG% OBPM DBPM BPM VORP
LeBron James 947 37062 .581 10.8 34.4 2.3 1.6 12.5 31.7 7.3 1.9 9.2 104.5
Michael Jordan* 1072 41011 .569 9.4 24.9 3.1 1.4 9.3 33.3 7.0 1.1 8.1 104.4
Provided by Basketball-Reference.com: View Original Table
Generated 1/15/2016.

As you can see, LeBron has been a slightly more efficient shooter, a slightly better rebounder and a significantly more prolific passer. Jordan, on the other hand, took better care of the ball, had greater usage, and had an edge in steals. Still, while LeBron has a slight 7.3 to 7.0 edge in Offensive Box Plus/Minus, it's his decisive 1.9 to 1.1 edge in Defensive BPM which gives him the edge in VORP despite playing about 4,000 fewer minutes than MJ. This is largely the result of LeBron playing for superior defensive teams throughout his career. When Jordan was winning titles in Chicago, they were elite defensively, but that was not always the case earlier (or later) in his career. Another factor, according to Myers, is that "Jordan's offensive stats look to the regression more like a pure offensive player than LeBron, possibly because they are more guard like. And guards usually have a bit less value on the defensive end."

While VORP is a cumulative stat, BPM is a rate stat which serves as the foundation for VORP. LeBron's 9.2 BPM seems to dwarf Jordan's 8.1 BPM. However, Jordan's BPM is weighed down by his geriatric years in Washington. A more fair comparison might be Jordan's 13 seasons in Chicago compared to LeBron's career (he's currently in his 13th season). As you can see, the numbers are more comparable, with LeBron owning a 9.2 to 9.0 edge in BPM and a 104.5 to 99.8 edge in VORP thanks to his 1,175-minute advantage in playing time (remember, Jordan missed the majority of the 1985-86 and 1994-95 seasons):
Player G MP TS% TRB% AST% STL% BLK% TOV% USG% OBPM DBPM BPM VORP
LeBron James 947 37062 .581 10.8 34.4 2.3 1.6 12.5 31.7 7.3 1.9 9.2 104.5
Michael Jordan* 930 35887 .580 9.4 24.9 3.3 1.5 9.3 33.5 7.7 1.3 9.0 99.8
Provided by Basketball-Reference.com: View Original Table
Generated 1/15/2016.
VORP and BPM are not the only advanced metrics we have on the site, however. In the eyes of Win Shares, LeBron still has a lot of work to do in order to catch His Airness. And Jordan himself is only fourth all-time. MJ is, however, the all-time leader in Win Shares per 48 minutes (while LeBron is 6th). Here are their career Win Share statistics compared, followed by a comparison of LeBron to Jordan's 13 seasons in Chicago:
Player G MP PER OWS DWS WS WS/48
LeBron James 947 37062 27.6 128.6 56.6 185.2 .240
Michael Jordan* 1072 41011 27.9 149.9 64.1 214.0 .250
Provided by Basketball-Reference.com: View Original Table
Generated 1/15/2016.
Player G MP PER OWS DWS WS WS/48
LeBron James 947 37062 27.6 128.6 56.6 185.2 .240
Michael Jordan* 930 35887 29.1 145.8 58.7 204.5 .274
Provided by Basketball-Reference.com: View Original Table
Generated 1/15/2016.
We're agnostics in the greatest of all time arguments, but we wanted to share this information with our users  as we noticed that VORP now has a new King.

Posted in Advanced Stats, Announcement, Basketball-Reference.com, History, Leaders, Statgeekery | 12 Comments »

Provisional 2015 Approximate Value Release

8th January 2016

With the AP releasing it's All-Pro teams today, we have an important piece of information for constructing our 2015 Approximate Values for NFL players. These numbers will change as Pro Bowl rosters change, but these values give a strong estimate of what the final 2015 AV numbers will look like (since All Pro nods have a far greater impact on AV than Pro Bowl nods do). At this time, the provisional leader in 2015 AV is J.J. Watt, with 21. For the time being, Watt's 88 AV through 5 seasons are the most in NFL history (we calculate AV back to 1960). The previous record had been 84 by Thurman Thomas. Something to ponder is that Watt was drafted between Blaine Gabbert and Christian Ponder in 2011.

As a reminder, Approximate Value is our method (developed by Doug Drinen) for putting a single numerical value on any player's season. You can read all about it here. You can see the all-time leaders in career AV here and the single-season leaders here.

The rest of the top 5 in 2015 Approximate Value can be seen below:

Screen Shot 2016-01-08 at 3.46.11 PM


Posted in Advanced Stats, Announcement, Data, Pro-Football-Reference.com | 2 Comments »

Time on Ice & Shift Details Added to Hockey Reference

20th October 2015

We just wanted to quickly note that we have added new tables of information to the bottom of team pages and also to the seasonal skater registers back to 2007-08.

These tables show average shift length for every player, and also breakdowns of time and performance at even strength, on the power play and shorthanded.

These new tables allow users to dig up the following info, among other things:

We hope you enjoy this new information. If you have any comments or questions, please reach out to us here.


Posted in Advanced Stats, Announcement, Data, Hockey-Reference.com | Comments Off on Time on Ice & Shift Details Added to Hockey Reference

Introducing NHL Expected +/-

7th October 2015

Hockey Reference is excited to introduce a new advanced hockey statistic we're calling Expected +/-. This new metric, utilizing league-wide shot location data, shows what we'd expect a player's +/- to be, based on where his team's shots and his opponent's shots came from while we has on the ice in even strength situations. The expected value of these shots is based upon league-wide shooting percentages from the various locations.

We have calculated the statistic for 2014-15 thus far, and will be calculating it for seasons moving forward, as well. As we get more shot location data, these values will eventually be based on three-year rolling averages, but as of now, 2014-15 is based entirely upon 2014-15 shot location data. When we say three-year rolling averages, what we mean is that, eventually, 2015-16 Expected +/- will be based upon shooting percentages from various locations on the ice from 2014-15 to 2016-17.

Here's the 2014-15 leaders:

Rk Player Age Tm Pos GP E+/- ?
1 Patrice Bergeron 29 BOS C 81 21.5
2 Nick Leddy 23 NYI D 78 19.6
3 Anders Lee 24 NYI C 76 19.6
4 John Tavares 24 NYI C 82 19.6
5 Anton Stralman 28 TBL D 82 17.6
6 Ryan Strome 21 NYI C 81 17.5
7 Nikita Kucherov 21 TBL RW 82 17.2
8 Brad Marchand 26 BOS LW 77 17.1
9 Brock Nelson 23 NYI C 82 17.1
10 Joe Thornton 35 SJS C 78 17.1
Provided by Hockey-Reference.com: View Original Table
Generated 10/7/2015.

As you can see, the Expected +/- leaderboard differs quite a bit from the actual +/- leaderboard, with only Nikita Kucherov appearing in the top ten of both. Expected +/- can potentially help identify some of the luck factor in raw +/- numbers:

Rk Player Age Tm Pos GP +/- ?
1 Nikita Kucherov 21 TBL RW 82 38
2 Max Pacioretty 26 MTL LW 80 38
3 Tyler Johnson 24 TBL C 77 33
4 Ondrej Palat 23 TBL LW 75 31
5 Jonathan Toews 26 CHI C 81 30
6 Rick Nash 30 NYR LW 79 29
7 Jason Garrison 30 TBL D 70 27
8 Vladimir Tarasenko 23 STL RW 77 27
9 Derek Stepan 24 NYR C 68 26
10 Blake Wheeler 28 WPG RW 79 26
Provided by Hockey-Reference.com: View Original Table
Generated 10/7/2015.

Since this metric considers the quality of shots (or at least their point of origin), it has an advantage over blunter instruments, like Corsi, which consider quantity, but not quality. However, unlike Corsi, Expected +/- does not include info on shots that weren't on goal, that were blocked, etc. So we see the stats as good complements for each other.

Currently, Expected +/- can be found for all players on the advanced tab of the 2014-15 Skaters register. Additionally, it can found in the Miscellaneous table on player pages.

On a game level, we have added shot charts to our box scores, as well. In the future, we plan to add heat maps showing shooting percentages by location for players, goalies, teams and league seasons. We will also be incorporating Expected +/- into our Player Advanced Stats Finder to allow for customized searches on this metric.

Finally, we would like to thank Wesley Yue for his valuable contributions to this concept.

Posted in Advanced Stats, Announcement, Data, Hockey-Reference.com | Comments Off on Introducing NHL Expected +/-

7 Ways to Dominate Your Fantasy League with PFR

1st September 2015

If I can be honest with you for a moment, I think my approach to fantasy football could use some work. Each year, I agree to join a friend's league and promptly forget about it until the hour before the draft, at which point, I binge read every draft kit and fantasy guide that I can put in front of my face. No matter what, it always ends the same way: me panicking in the 7th round and trying to draft Tshimanga Biakabutuka.

This year will be different. Why? Because this year, we're going to use Pro Football Reference. No more fighting for the same 5 sleepers everyone else wants or drafting Brandon Marshall three rounds too early because you forgot that he got traded to the Jets. We're going to get through this together, you guys.

This year, we've ramped up fantasy coverage on PFR, adding a lot of red zone and matchup data to give you all the info you need. So from the draft, to setting your lineup, to dominating the waiver wire, here's seven ways that PFR will lead you to fantasy glory.

1. We Have Fantasy Points!

That's right, we keep track of fantasy points, based on standard scoring systems (read the details in the glossary). That means that, if you're considering drafting a player, you can pull up his page and see a chart like this:

Year Age G FantPos FantPt VBD PosRank OvRank
2011 23 13 RB 120 30
2012 24 10 RB 111 28
2013 25 14 RB 205 79 7 17
2014 26 16 RB 292 173 1 1
728 252
Provided by Pro-Football-Reference.com: View Original Table
Generated 8/17/2015.


Those are DeMarco Murray's fantasy numbers. In addition to the raw fantasy points, we also have a number called VBD, which subtracts a player's overall fantasy score from the “baseline” score, which is the score of the 12th-ranked QB, 24th-ranked RB, 30th-ranked WR, or 12th-ranked TE, giving you a number that's roughly fantasy football's cousin to Runs Above Average. Lastly, you can see both his overall rank vs the baseline and positional rank.

VBD is how we determine the overall rank; it lets us see the players who most outperformed the baseline for their position and gave players the biggest advantage over the competition. By VBD, here's the top performers since 2012:

vbd leaders

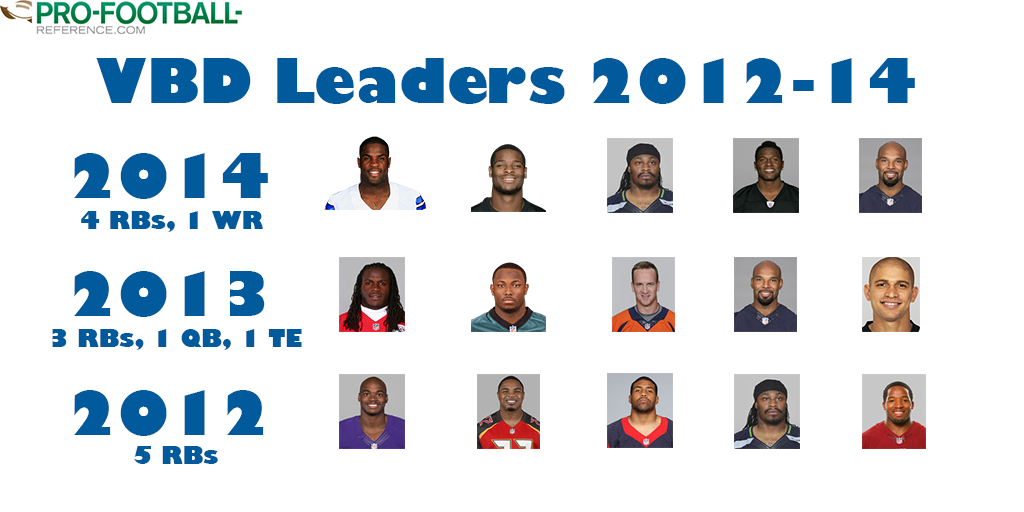
As you can see RBs have an advantage, coming in first all three years (2011's leader was Aaron Rodgers). However, there does tend to be a non-RB player in the top 5. All in all, last year's Top 20 included 8 RBs, 9 WRs, 2 QBs, and 1 Gronk.

However, we're just scratching the surface of the data. In the grey bar towards the top of a player's profile, you'll see a fantasy section. If you click on it, you can get a table like this:

Inside 20 Inside 10 Snap Counts
Rushing Receiving Rushing Off. Def. Sp Tms Fantasy
Rk Att Yds TD Tgt Rec Yds TD Att Yds TD Num Pct Num Pct Num Pct FantPt DKPt FDPt
1 1 2 1 0 0 0 0 1 2 1 61 88.4 0 0.0 0 0.0 18.3 25.3 19.8
2 2 16 1 0 0 0 0 1 3 1 58 71.6 0 0.0 0 0.0 21.3 26.3 21.8
3 2 -4 1 1 1 5 0 1 1 1 44 78.6 0 0.0 1 1.3 17.1 25.1 19.1
4 3 25 1 0 0 0 0 1 -1 0 50 75.8 0 0.0 0 0.0 27.5 31.5 28.0
5 4 14 0 1 1 3 0 1 5 0 67 88.2 0 0.0 0 0.0 17.2 27.2 20.2
6 7 25 1 0 0 0 0 2 5 0 52 69.3 0 0.0 0 0.0 20.6 29.6 23.6
7 2 1 1 0 0 0 0 1 1 1 44 71.0 0 0.0 0 0.0 19.2 23.2 19.7
8 1 3 0 0 0 0 0 1 3 0 43 66.2 0 0.0 0 0.0 20.1 28.1 22.1
9 2 1 0 0 0 0 0 0 0 0 43 67.2 0 0.0 0 0.0 9.0 13.0 11.0
10 1 4 0 0 0 0 0 1 4 0 36 60.0 0 0.0 0 0.0 13.1 22.1 16.1
11 1 3 0 0 0 0 0 1 3 0 51 94.4 0 0.0 0 0.0 14.3 19.3 15.3
12 4 12 1 0 0 0 0 3 3 1 48 78.7 0 0.0 0 0.0 17.3 23.3 20.3
13 10 9 1 1 1 6 0 5 -10 1 58 93.5 0 0.0 0 0.0 28.8 40.8 33.3
14 7 15 2 0 0 0 0 5 6 2 57 69.5 0 0.0 0 0.0 20.4 21.4 20.9
15 6 7 1 0 0 0 0 2 2 1 31 49.2 0 0.0 0 0.0 11.8 11.8 11.8
16 3 15 1 1 1 5 0 2 13 1 40 62.5 0 0.0 0 0.0 18.1 24.1 19.6
56 148 12 4 4 19 0 28 40 10 783 0 1 294.1 392.1 322.6
Provided by Pro-Football-Reference.com: View Original Table
Generated 9/1/2015.


Those are DeMarco Murray's game-by-game fantasy stats for 2014. You can see his points, snap counts, and red zone data (hold that thought on the last one).

2. The Season Finder is Rad...

Of course, having fantasy stats is one thing, but actually harnessing them is another. That's where the Play Index comes in. Just like how you can use the Season Finder to sort through traditional season stats like passing yards and receiving TDs, you can also sift through fantasy points. For example, here's the 2014 fantasy point leaders:

Games Fantasy
Rk Year Age Draft Tm Lg G GS FantPt FantPt/G
1 Aaron Rodgers 2014 31 1-24 GNB NFL 16 16 356.1 22.26
2 Andrew Luck 2014 25 1-1 IND NFL 16 16 355.7 22.23
3 Russell Wilson 2014 26 3-75 SEA NFL 16 16 331.6 20.73
4 Peyton Manning 2014 38 1-1 DEN NFL 16 16 310.7 19.42
5 Ben Roethlisberger 2014 32 1-11 PIT NFL 16 16 310.2 19.39
6 Drew Brees 2014 35 2-32 NOR NFL 16 16 305.0 19.06
7 DeMarco Murray 2014 26 3-71 DAL NFL 16 16 292.1 18.26
8 Le'Veon Bell 2014 22 2-48 PIT NFL 16 16 287.5 17.97
9 Matt Ryan 2014 29 1-3 ATL NFL 16 16 284.3 17.77
10 Tom Brady 2014 37 6-199 NWE NFL 16 16 280.1 17.51
Provided by Pro-Football-Reference.com: View Original Table
Generated 8/17/2015.


Torn between a RB or a QB with a late first round pick? This can help you strategize. Depending on who is still on the board, you can use the season finder to compare the dropoff from the top QB to one further down the list and see if it would be higher than, say, the dropoff from the 6th or 7th RB. But the Season Finder may be more useful in making decisions within a position. For example, here's the top 15 WRs in Fantasy Points since 2012:

Games Fantasy Passing
Rk From To Draft Tm Lg G GS FantPt FantPt/G
1 Demaryius Thomas 2012 2014 1-22 DEN NFL 48 48 654.3 13.63
2 Dez Bryant 2012 2014 1-24 DAL NFL 48 46 639.1 13.31
3 Calvin Johnson 2012 2014 1-2 DET NFL 43 43 597.3 13.89
4 Antonio Brown 2012 2014 6-195 PIT NFL 45 40 555.9 12.35
5 A.J. Green 2012 2014 1-4 CIN NFL 45 45 547.7 12.17
6 Brandon Marshall 2012 2014 4-119 CHI NFL 45 45 540.2 12.00
7 Jordy Nelson 2012 2014 2-36 GNB NFL 44 42 527.8 12.00
8 Eric Decker 2012 2014 3-87 TOT NFL 47 46 503.4 10.71
9 Vincent Jackson 2012 2014 2-61 TAM NFL 48 48 463.0 9.65
10 Andre Johnson 2012 2014 1-3 HTX NFL 47 47 462.1 9.83
11 T.Y. Hilton 2012 2014 3-92 CLT NFL 46 26 448.4 9.75
12 Julio Jones 2012 2014 1-6 ATL NFL 36 35 444.9 12.36
13 Randall Cobb 2012 2014 2-64 GNB NFL 37 28 432.1 11.68
14 DeSean Jackson 2012 2014 2-49 TOT NFL 42 40 426.3 10.15
15 Alshon Jeffery 2012 2014 2-45 CHI NFL 42 36 425.9 10.14
Provided by Pro-Football-Reference.com: View Original Table
Generated 8/17/2015.


While we may want to believe that a Larry Fitzgerald bounceback is coming, he's only been the 27th highest ranked WR over the last three years. On the other hand, while Andre Johnson's numbers lagged a little last year, over the last three seasons he's been a Top 10 WR, and he's upgrading at QB from Ryan Fitzpatrick to Andrew Luck. ESPN has him going 25th among WR, meaning you could be buying low on a nice rebound candidate.

3. ...But the Game Finder May Be Better

Of course, unless you're in a somewhat unusual league, these season numbers will only do so much. Most of us play fantasy football week-to-week, game-to-game. If only there were some tool that let you search individual games the same way the Season Finder does with seasons...wait, there is!

It's called the Game Finder and it's incredible. You can get info on a game-by-game level, which means that you can actually break down the numbers to the basic unit of a fantasy season. And, of course, the Game Finder has Fantasy Points like the Season Finder. So, for example, if you care about consistency, you can see who has the most 18+ point games since 2012:

Rk From To Tm W L T W-L% Count
1 Drew Brees 2012 2014 NOR 21 12 0 0.636 33
2 Peyton Manning 2012 2014 DEN 28 5 0 0.848 33
3 Andrew Luck 2012 2014 IND 20 7 0 0.741 27
4 Aaron Rodgers 2012 2014 GNB 21 5 0 0.808 26
5 Tom Brady 2012 2014 NWE 21 4 0 0.840 25
6 Russell Wilson 2012 2014 SEA 19 4 0 0.826 23
7 Cam Newton 2012 2014 CAR 17 4 1 0.795 22
8 Tony Romo 2012 2014 DAL 15 7 0 0.682 22
9 Matt Ryan 2012 2014 ATL 13 8 0 0.619 21
10 Matthew Stafford 2012 2014 DET 13 8 0 0.619 21
11 Philip Rivers 2012 2014 SDG 14 6 0 0.700 20
12 Andy Dalton 2012 2014 CIN 15 3 1 0.816 19
13 Jamaal Charles 2012 2014 KAN 10 8 0 0.556 18
14 Marshawn Lynch 2012 2014 SEA 17 1 0 0.944 18
15 Colin Kaepernick 2012 2014 SFO 15 2 0 0.882 17
16 Jay Cutler 2012 2014 CHI 9 6 0 0.600 15
17 Joe Flacco 2012 2014 BAL 10 5 0 0.667 15
18 Robert Griffin 2012 2014 WAS 6 9 0 0.400 15
19 Ben Roethlisberger 2012 2014 PIT 7 8 0 0.467 15
Provided by Pro-Football-Reference.com: View Original Table
Generated 8/14/2015.


Some of these bets seem like safer ones than others (Hi, RG3), but if you're picking between Big Ben (ranked 6 among QBs by ESPN) or Cam (ranked 8th), this can be one factor you keep in mind. On the other hand, if you prefer a high ceiling, you can set the parameters higher. For example, these are the players with 30 point games last year:

Rk From To Tm W L T W-L% Count
1 Andrew Luck 2014 2014 IND 3 0 0 1.000 3
2 Russell Wilson 2014 2014 SEA 2 1 0 0.667 3
3 Le'Veon Bell 2014 2014 PIT 1 1 0 0.500 2
4 Tom Brady 2014 2014 NWE 2 0 0 1.000 2
5 Cam Newton 2014 2014 CAR 1 0 1 0.750 2
6 Ben Roethlisberger 2014 2014 PIT 2 0 0 1.000 2
7 Matt Ryan 2014 2014 ATL 1 1 0 0.500 2
8 Odell Beckham 2014 2014 NYG 1 0 0 1.000 1
9 Drew Brees 2014 2014 NOR 1 0 0 1.000 1
10 Mike Evans 2014 2014 TAM 1 0 0 1.000 1
11 Ryan Fitzpatrick 2014 2014 HOU 1 0 0 1.000 1
12 Joe Flacco 2014 2014 BAL 1 0 0 1.000 1
13 Justin Forsett 2014 2014 BAL 1 0 0 1.000 1
14 Arian Foster 2014 2014 HOU 1 0 0 1.000 1
15 Jonas Gray 2014 2014 NWE 1 0 0 1.000 1
16 Rob Gronkowski 2014 2014 NWE 1 0 0 1.000 1
17 T.Y. Hilton 2014 2014 IND 1 0 0 1.000 1
18 DeAndre Hopkins 2014 2014 HOU 1 0 0 1.000 1
19 Julio Jones 2014 2014 ATL 0 1 0 0.000 1
20 Marshawn Lynch 2014 2014 SEA 1 0 0 1.000 1
Rk From To Tm W L T W-L% Count
21 Jeremy Maclin 2014 2014 PHI 0 1 0 0.000 1
22 Eli Manning 2014 2014 NYG 1 0 0 1.000 1
23 Peyton Manning 2014 2014 DEN 1 0 0 1.000 1
24 Tre Mason 2014 2014 STL 1 0 0 1.000 1
25 Branden Oliver 2014 2014 SDG 1 0 0 1.000 1
26 Aaron Rodgers 2014 2014 GNB 1 0 0 1.000 1
27 Emmanuel Sanders 2014 2014 DEN 1 0 0 1.000 1
28 Matthew Stafford 2014 2014 DET 1 0 0 1.000 1
29 Demaryius Thomas 2014 2014 DEN 1 0 0 1.000 1
Provided by Pro-Football-Reference.com: View Original Table
Generated 8/14/2015.


A good fantasy team will balance risky players with high ceilings and consistent players with low floors. With the Game Finder, you can get both.

4. Check the Red Zone

Remember that DeMarco Murray chart I showed you earlier. Well, it shows off one of our newest features: red zone data. We can track targets, carries, yards, and TDs on plays that start within the 20 and within the 10:

Inside 20 Inside 10
Tm Tgt Rec Ctch% Yds TD %Tgt Tgt Rec Ctch% Yds TD %Tgt
Demaryius Thomas DEN 39 18 46.15 137 6 36.8% 18 6 33.33 33 4 36.0%
Antonio Brown PIT 34 19 55.88 149 9 36.6% 18 9 50.00 45 6 36.7%
Andre Johnson HOU 26 12 46.15 54 3 38.8% 11 5 45.45 25 3 50.0%
Jordy Nelson GNB 26 13 50.00 93 5 26.8% 15 5 33.33 24 3 31.9%
Odell Beckham NYG 25 16 64.00 122 8 25.5% 9 5 55.56 32 5 18.4%
Randall Cobb GNB 25 16 64.00 94 10 25.8% 13 10 76.92 37 8 27.7%
Alshon Jeffery CHI 22 10 45.45 69 7 27.8% 17 6 35.29 35 5 44.7%
Martellus Bennett CHI 21 11 52.38 86 5 26.6% 7 4 57.14 18 2 18.4%
Julian Edelman NWE 21 13 61.90 83 4 27.6% 10 5 50.00 29 4 25.0%
Jimmy Graham NOR 21 12 57.14 78 9 25.0% 10 6 60.00 19 6 29.4%
Larry Donnell NYG 20 11 55.00 64 6 20.4% 12 7 58.33 31 5 24.5%
Charles Clay MIA 19 8 42.11 51 2 21.1% 13 3 23.08 8 1 31.7%
Antonio Gates SDG 19 10 52.63 64 9 26.4% 14 7 50.00 35 7 34.1%
Rueben Randle NYG 19 8 42.11 57 3 19.4% 10 4 40.00 20 3 20.4%
Emmanuel Sanders DEN 19 16 84.21 84 6 17.9% 10 8 80.00 33 5 20.0%
Mike Wallace MIA 19 13 68.42 113 9 21.1% 6 4 66.67 22 4 14.6%
Steve Smith BAL 18 8 44.44 46 2 25.4% 6 2 33.33 5 1 18.2%
Rob Gronkowski NWE 16 11 68.75 81 9 21.1% 7 6 85.71 24 6 17.5%
Anquan Boldin SFO 15 8 53.33 76 2 34.9% 4 1 25.00 7 0 21.1%
Vincent Jackson TAM 15 3 20.00 18 2 28.8% 8 2 25.00 8 2 32.0%
Provided by Pro-Football-Reference.com: View Original Table
Generated 9/1/2015.


This gives you a lot of info. Not only can you see how many times someone scored, but you can also see how many times the team tried to score with them. In theory, someone with more targets could see their TD numbers go up if he keeps getting the same opportunities. On the other hand, you may want to bet on the high-efficiency players who convert more of their targets into scores (click to enlarge):

4 kinds of receiviers

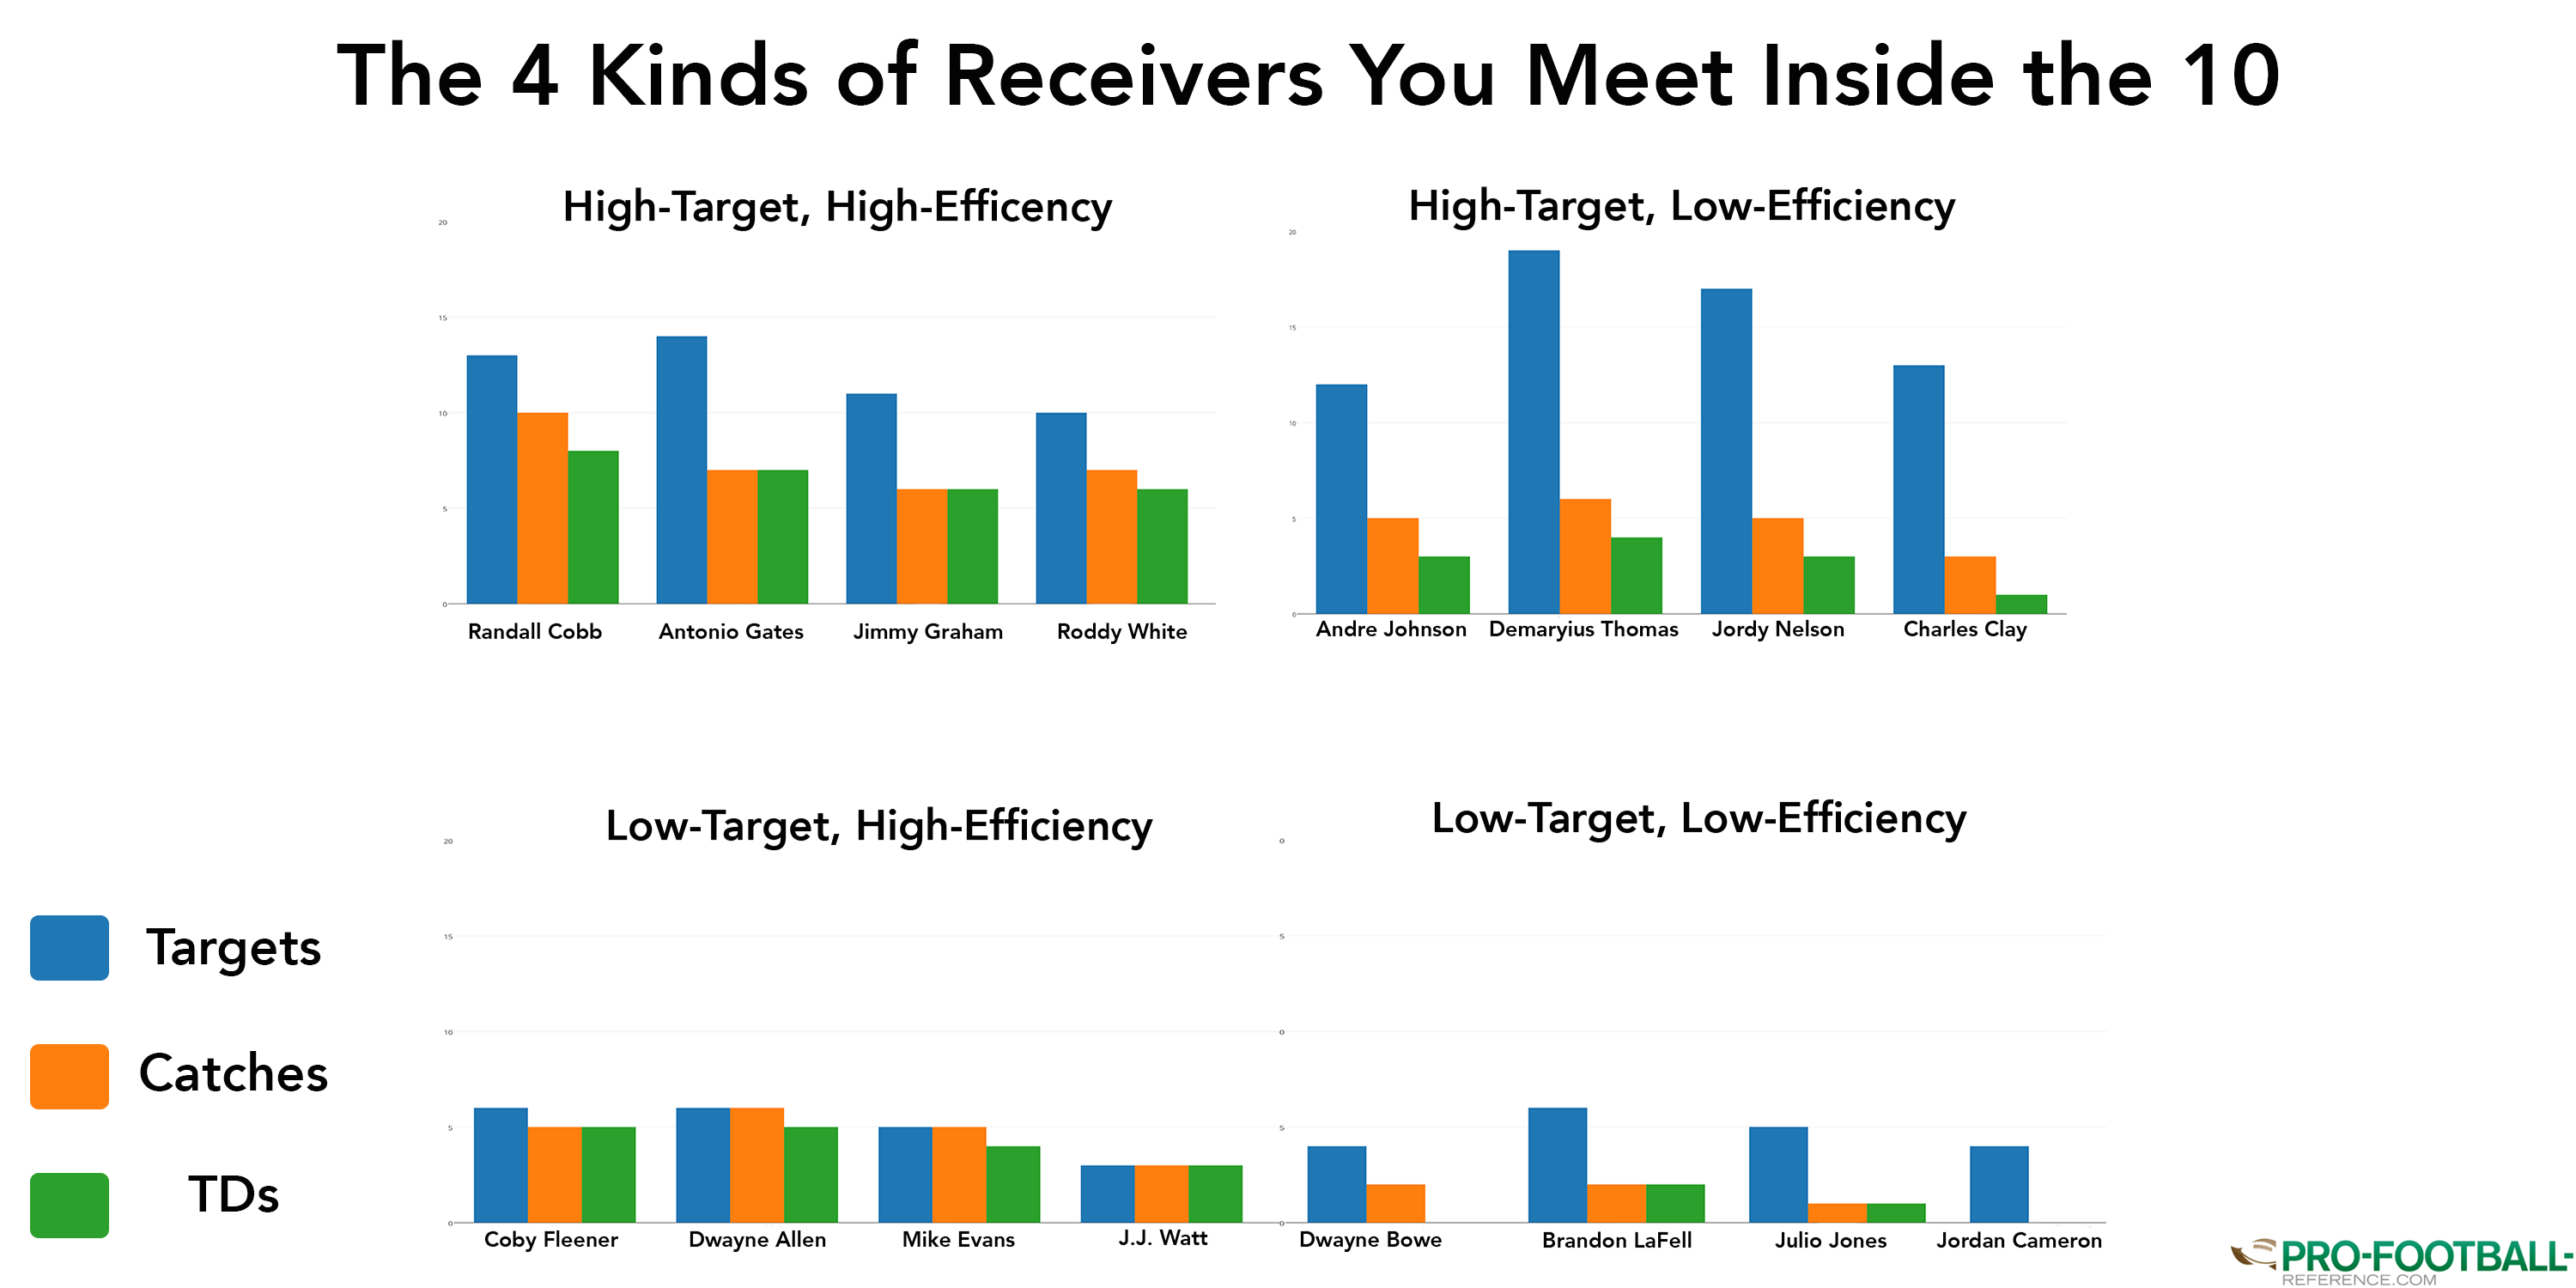
We track these numbers for rushing and passing, as well as receiving. More importantly, we'll be keeping tabs on these in 2015 too. Just click over to any 2015 NFL season page and hover over fantasy on the grey menu bar. Once the season starts, we'll have all the data you need to win on the waiver wire, as well as in your draft.

5. Know Your Advanced Stats

Anybody can look at passing yards or TDs for a quarterback, but our database goes deeper, with per attempt numbers and index stats.

For quarterbacks, we track yards per attempt, but also advanced stats like Adjusted Yards per Attempt (AY/A) and Adjusted Net Yards per Attempt (ANY/A). If you're a basketball fan, you can think of it as something similar to TS%. If you're not a basketball fan or don't know that stat, these numbers adjust a player's yardage per attempt to give them additional credit for TDs and blame for INTs. To decide which one to use, you'll want to know if your league penalizes QBs for sacks. If so, you'll want to use ANY/A, which accounts for sacks. If not, stick with AY/A, which only covers passing yards, TDs, and INTs. Looking at the AY/A leaders with at least 200 attempts last year, here's what you get:

Games Passing
Rk Tm G Cmp Att Cmp% Yds TD Int Rate Sk Y/A Yds AY/A ANY/A Y/G W L T
1 Aaron Rodgers GNB 16 341 520 65.58 4381 38 5 112.2 28 8.43 174 9.45 8.65 273.8 12 4 0
2 Tony Romo DAL 15 304 435 69.89 3705 34 9 113.2 29 8.52 215 9.15 8.11 247.0 12 3 0
3 Ben Roethlisberger PIT 16 408 608 67.11 4952 32 9 103.3 33 8.14 172 8.53 7.82 309.5 11 5 0
4 Peyton Manning DEN 16 395 597 66.16 4727 39 15 101.5 17 7.92 118 8.09 7.68 295.4 12 4 0
5 Ryan Fitzpatrick HTX 12 197 312 63.14 2483 17 8 95.3 21 7.96 83 7.89 7.15 206.9 6 6 0
6 Russell Wilson SEA 16 285 452 63.05 3475 20 7 95.0 42 7.69 242 7.88 6.72 217.2 12 4 0
7 Andrew Luck CLT 16 380 616 61.69 4761 40 16 96.5 27 7.73 161 7.86 7.28 297.6 11 5 0
8 Carson Palmer CRD 6 141 224 62.95 1626 11 3 95.6 9 7.26 59 7.64 7.09 271.0 6 0 0
9 Tom Brady NWE 16 373 582 64.09 4109 33 9 97.4 21 7.06 134 7.50 7.01 256.8 12 4 0
10 Kirk Cousins WAS 6 126 204 61.76 1710 10 9 86.4 8 8.38 70 7.38 6.77 285.0 1 4 0
11 Drew Brees NOR 16 456 659 69.20 4952 33 17 97.0 29 7.51 186 7.36 6.77 309.5 7 9 0
12 Matt Ryan ATL 16 415 628 66.08 4694 28 14 93.9 31 7.47 205 7.36 6.71 293.4 6 10 0
13 Eli Manning NYG 16 379 601 63.06 4410 30 14 92.1 28 7.34 187 7.29 6.67 275.6 6 10 0
14 Alex Smith KAN 15 303 464 65.30 3265 18 6 93.4 45 7.04 229 7.23 6.14 217.7 8 7 0
15 Joe Flacco RAV 16 344 554 62.09 3986 27 12 91.0 19 7.19 167 7.19 6.66 249.1 10 6 0
16 Philip Rivers SDG 16 379 570 66.49 4286 31 18 93.8 36 7.52 189 7.19 6.45 267.9 9 7 0
17 Mark Sanchez PHI 9 198 309 64.08 2418 14 11 88.4 23 7.83 151 7.13 6.18 268.7 4 4 0
18 Robert Griffin WAS 9 147 214 68.69 1694 4 6 86.9 33 7.92 227 7.03 5.17 188.2 2 5 0
19 Matthew Stafford DET 16 363 602 60.30 4257 22 12 85.7 45 7.07 254 6.91 6.03 266.1 11 5 0
20 Colin Kaepernick SFO 16 289 478 60.46 3369 19 10 86.4 52 7.05 344 6.90 5.58 210.6 8 8 0
Provided by Pro-Football-Reference.com: View Original Table
Generated 8/17/2015.


Because this is a rate state, and fantasy is a game of bulk, a top scorer like Andrew Luck may be a little lower than where you'd take him in a draft. However, it can alert you to potential warning signs or point out potential sleepers. If the Saints try to run more this year, per rumors, Drew Brees may lose a lot of his value, since his AY/A is already low and his bulk production would also go down (on the other hand, perhaps a more balanced attack would make him more efficient). Meanwhile, guys like Roethlisberger or Tony Romo could be good value picks if you wait on a QB. Or maybe just take Aaron Rodgers and don't overthink it.

With new advanced stats, it can sometimes be tough to tell who is better than whom, and by how much. That's why I like looking at index stats. An index stat will be familiar to anyone whose ever seen ERA+ or OPS+ in baseball. We have index stats for pretty much all the important passing numbers, so rather than looking at just Passing TD%, something like TD%+ might be easier to digest.

With an index stat, it will always be indicated by a + or - (for these passing stats, you'll only need to worry about the +). A score of 100 means that the player's number was average for that season. If it's higher than that, it means they were that percentage better than average. Lower, and it means they were that much worse:

Games Advanced Passing
Rk Tm G TD%+
1 Tony Romo DAL 15 138
2 Aaron Rodgers GNB 16 132
3 Andrew Luck CLT 16 123
4 Peyton Manning DEN 16 123
5 Tom Brady NWE 16 114
6 Ryan Fitzpatrick HTX 12 111
7 Philip Rivers SDG 16 111
8 Ben Roethlisberger PIT 16 109
9 Drew Brees NOR 16 106
10 Jay Cutler CHI 15 106
11 Eli Manning NYG 16 106
12 Kirk Cousins WAS 6 105
13 Joe Flacco RAV 16 105
14 Mike Glennon TAM 6 105
15 Carson Palmer CRD 6 105
16 Mark Sanchez PHI 9 101
17 Ryan Tannehill MIA 16 101
18 Matt Ryan ATL 16 100
19 Russell Wilson SEA 16 100
20 Austin Davis RAM 10 97
Provided by Pro-Football-Reference.com: View Original Table
Generated 8/17/2015.


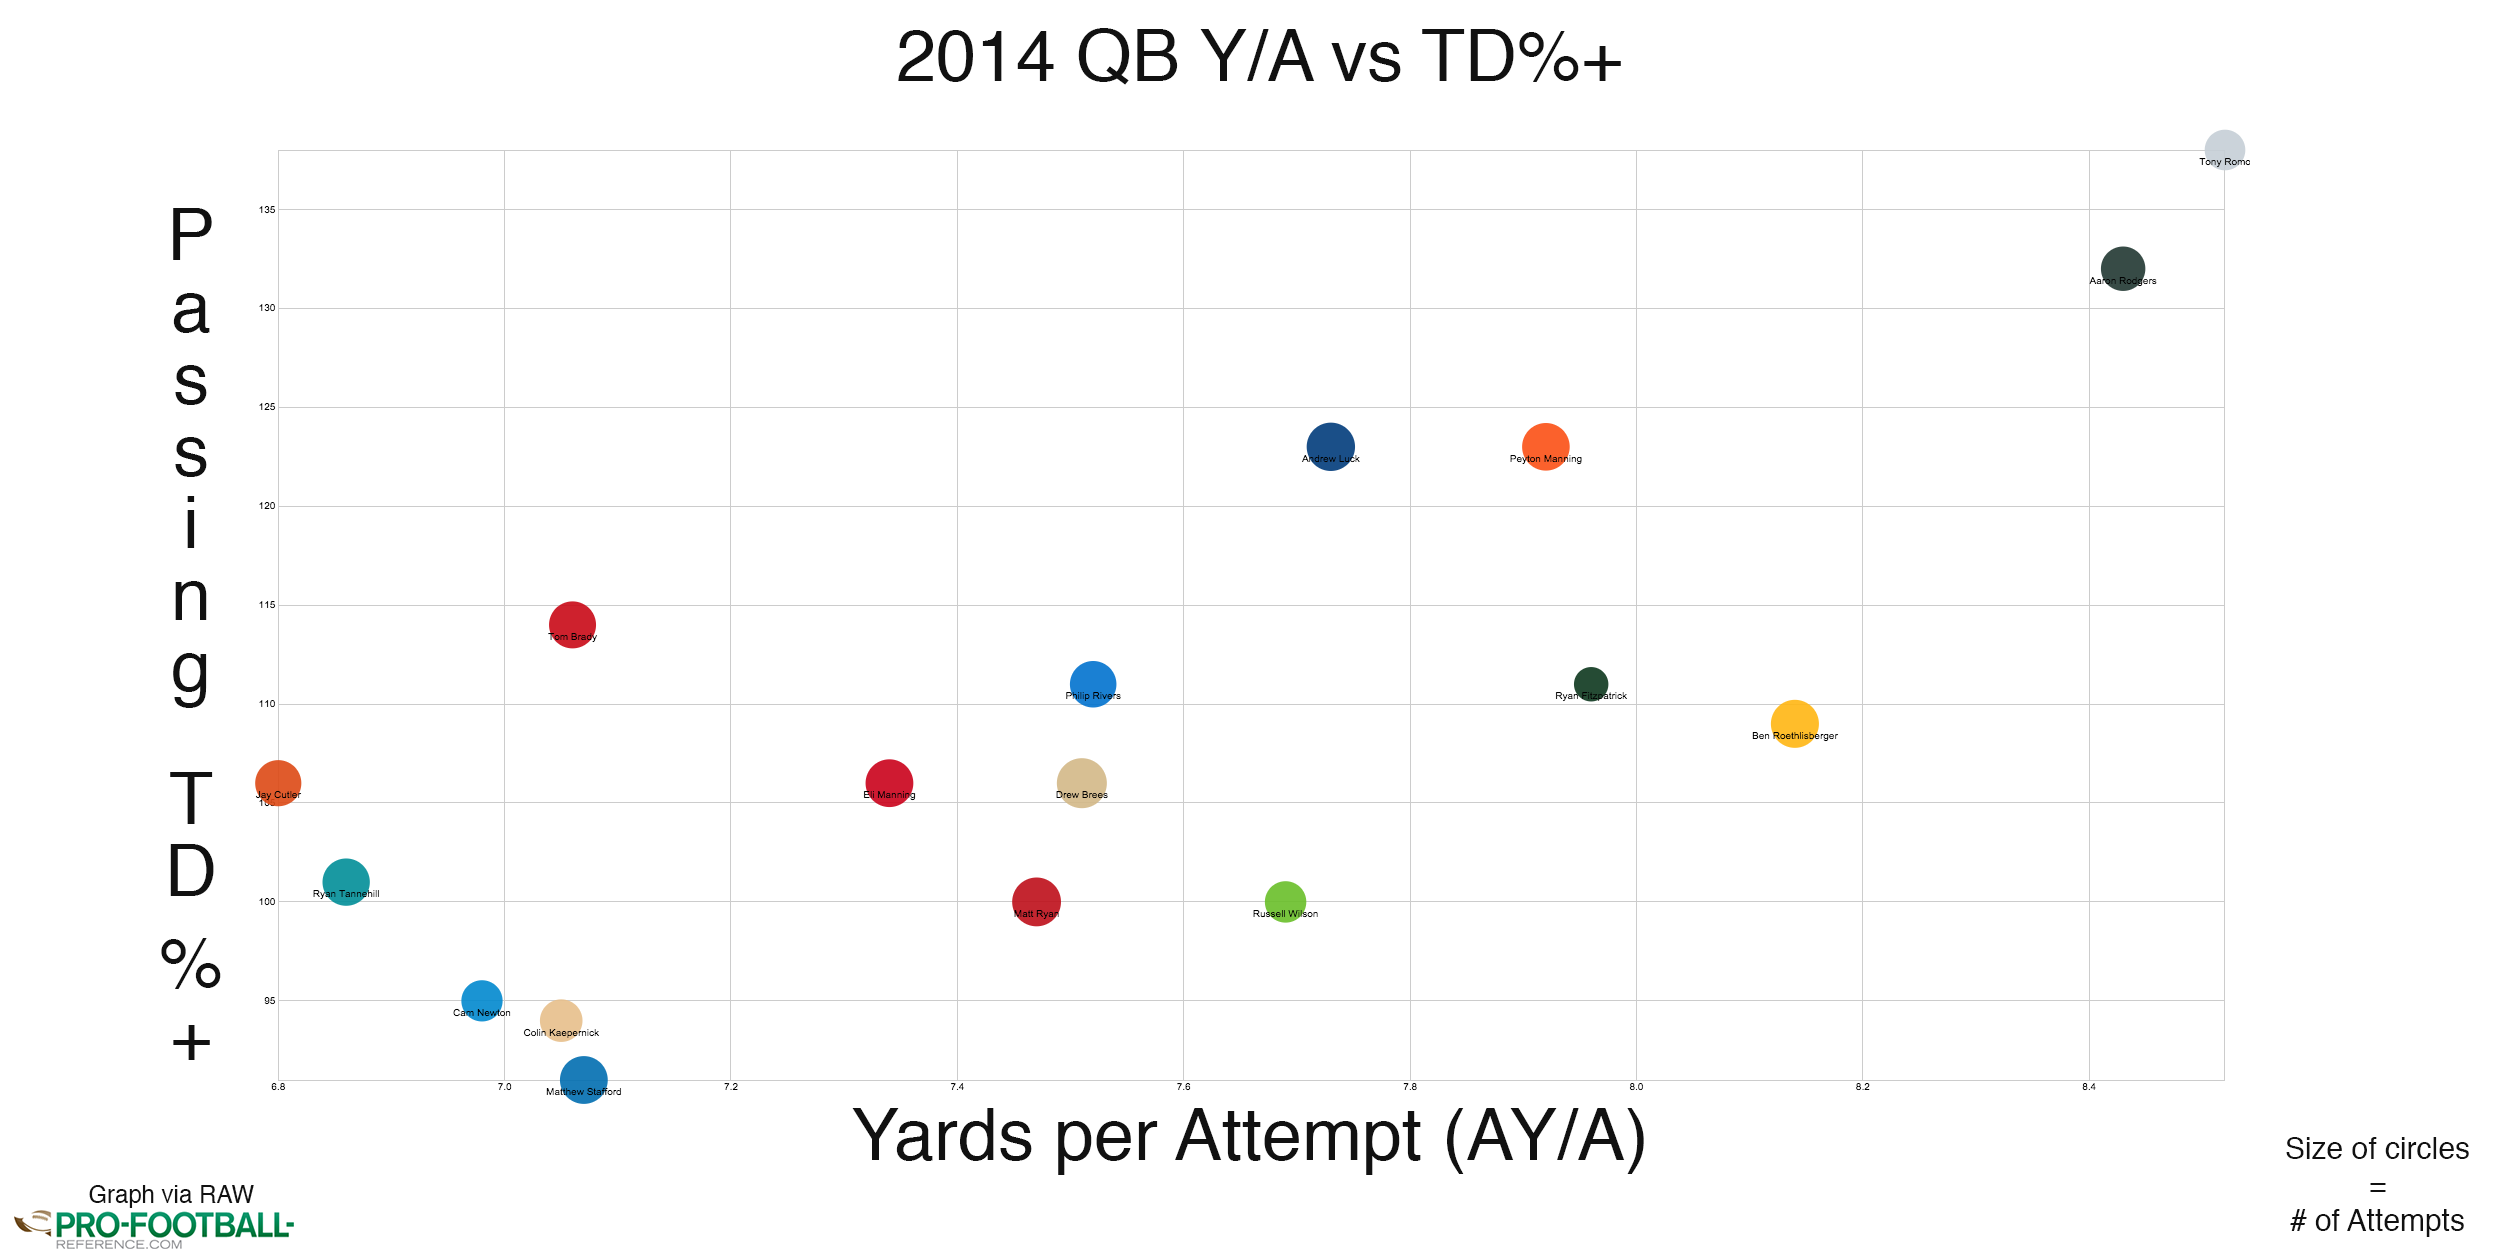
Tony Romo's 138 means that his TD% was 38% better than average, meaning, again, he could be a sneaky play. Or you could go with Rodgers or Luck and know you'll have an elite TD-slinging QB.

Putting it all together, here's a scatter plot showing the Top 16 fantasy QBs (plus Ryan Fitzpatrick, who grades out surprisingly well by these metrics). On one axis, we have Y/A, giving us an idea of their efficiency and yardage totals. On the other, we have TD%+, for their scoring. The size of the circles reflects the number of pass attempts, giving us some idea of bulk (click on the picture to enlarge):

Click to enlarge

6. Play the Matchups

The draft is just the start of your season, and we'll be there to help as you navigate the endless lineup tinkering that comes with the fantasy season. In order to win, you'll be spending a lot of time researching the teams that your players are facing. Fortunately, we keep tables with all sorts of team defensive data.

Remember AY/A? I mean, we were just talking about it. Well, not only can you see it for the QBs, but you can check team's AY/A against, to get a look at how their defense has fared beyond simple points and yards allowed:

Rk Tm G Cmp Att Cmp% Yds TD TD% Int Int% Lng Y/A AY/A ?
1 Washington Redskins 16 345 519 66.5 3990 35 6.7 7 1.3 8.2 8.9
2 Chicago Bears 16 366 548 66.8 4230 34 6.2 14 2.6 8.1 8.2
3 New York Jets 16 345 538 64.1 3746 31 5.8 6 1.1 7.5 8.2
4 Jacksonville Jaguars 16 355 541 65.6 3899 24 4.4 6 1.1 7.7 8.1
5 Pittsburgh Steelers 16 350 543 64.5 4049 30 5.5 11 2.0 7.8 8.0
6 Philadelphia Eagles 16 345 591 58.4 4238 30 5.1 12 2.0 7.8 7.9
7 Oakland Raiders 16 343 538 63.8 3810 29 5.4 9 1.7 7.4 7.7
8 New Orleans Saints 16 341 546 62.5 4019 26 4.8 12 2.2 7.7 7.7
9 Atlanta Falcons 16 359 566 63.4 4478 20 3.5 16 2.8 8.2 7.6
10 Tampa Bay Buccaneers 16 387 563 68.7 4084 28 5.0 14 2.5 7.6 7.5
11 New York Giants 16 324 522 62.1 3850 25 4.8 17 3.3 8.0 7.5
12 Tennessee Titans 16 347 545 63.7 3773 28 5.1 12 2.2 7.3 7.4
13 Indianapolis Colts 16 320 543 58.9 3669 27 5.0 12 2.2 7.2 7.2
14 San Diego Chargers 16 320 524 61.1 3427 24 4.6 7 1.3 6.9 7.2
15 Baltimore Ravens 16 382 595 64.2 3979 22 3.7 11 1.8 7.3 7.2
16 St. Louis Rams 16 368 540 68.1 3861 18 3.3 13 2.4 7.6 7.2
17 Minnesota Vikings 16 353 534 66.1 3572 26 4.9 13 2.4 7.1 7.0
Avg Team 350.0 558.7 62.6 3789.0 25.2 4.5 14.1 2.5 74 7.2 7.0
18 Arizona Cardinals 16 365 579 63.0 4152 22 3.8 18 3.1 7.6 7.0
19 Miami Dolphins 16 338 537 62.9 3557 27 5.0 14 2.6 7.0 6.8
20 New England Patriots 16 342 574 59.6 3837 24 4.2 16 2.8 7.2 6.8
21 Dallas Cowboys 16 371 558 66.5 4031 22 3.9 18 3.2 7.5 6.8
22 Carolina Panthers 16 364 562 64.8 3645 25 4.4 14 2.5 7.0 6.7
23 Kansas City Chiefs 16 318 545 58.3 3252 22 4.0 6 1.1 6.4 6.7
24 Green Bay Packers 16 333 564 59.0 3623 26 4.6 18 3.2 6.9 6.4
25 Houston Texans 16 363 619 58.6 3890 28 4.5 20 3.2 6.7 6.1
26 Detroit Lions 16 383 592 64.7 3706 23 3.9 20 3.4 6.8 6.0
27 San Francisco 49ers 16 324 551 58.8 3531 29 5.3 23 4.2 6.8 5.9
28 Seattle Seahawks 16 313 507 61.7 2970 17 3.4 13 2.6 6.3 5.8
29 Denver Broncos 16 399 641 62.2 3607 29 4.5 18 2.8 6.0 5.7
30 Cincinnati Bengals 16 365 608 60.0 3888 18 3.0 20 3.3 6.6 5.7
31 Cleveland Browns 16 335 587 57.1 3592 22 3.7 21 3.6 6.4 5.6
32 Buffalo Bills 16 337 559 60.3 3292 16 2.9 19 3.4 6.4 5.5
League Total 11200 17879 62.6 121247 807 4.5 450 2.5 94 7.2 7.0
Avg Tm/G 21.9 34.9 62.6 236.8 1.6 4.5 0.9 2.5 7.2 7.0
Provided by Pro-Football-Reference.com: View Original Table
Generated 8/14/2015.


Even though Washington was merely a bottom 10 team by passing yards allowed, their AY/A shows that they got pummeled through the air. Of course, defense is not always consistent from year-to-year, so you'll want to pay close attention to how the 2015 numbers start to shake out early.

This year, our database goes even deeper, with matchup data by position. For instance, here's how every team's defense fared against TEs in 2014:

Receiving Fantasy Fantasy per Game
Tm G Tgt Rec Yds TD FantPt DKPt FDPt FantPt DKPt FDPt
Chicago Bears 16 107 77 889 13 166.7 246.7 205.2 10.4 15.4 12.8
New York Jets 16 104 75 810 14 165.0 240.0 202.5 10.3 15.0 12.7
Indianapolis Colts 16 115 83 954 10 155.9 247.4 196.9 9.7 15.5 12.3
Arizona Cardinals 16 123 86 1090 8 155.0 248.0 198.0 9.7 15.5 12.4
Washington Redskins 16 105 69 848 11 150.8 224.8 187.3 9.4 14.1 11.7
Dallas Cowboys 16 146 107 1033 9 147.3 262.3 200.8 9.2 16.4 12.6
Tennessee Titans 16 108 73 799 11 146.2 218.9 182.4 9.1 13.7 11.4
San Francisco 49ers 16 135 80 924 9 144.7 228.7 184.7 9.0 14.3 11.5
New England Patriots 16 121 79 997 6 139.7 222.7 177.2 8.7 13.9 11.1
New York Giants 16 111 67 844 8 137.8 201.8 167.3 8.6 12.6 10.5
Denver Broncos 16 130 91 867 8 136.9 228.9 180.4 8.6 14.3 11.3
Pittsburgh Steelers 16 98 62 693 11 135.5 200.3 166.3 8.5 12.5 10.4
Oakland Raiders 16 98 65 808 9 132.8 198.8 165.3 8.3 12.4 10.3
Jacksonville Jaguars 16 117 72 858 7 125.8 198.8 161.8 7.9 12.4 10.1
Seattle Seahawks 16 94 60 593 11 125.3 184.3 153.3 7.8 11.5 9.6
Minnesota Vikings 16 114 75 905 5 118.5 200.5 156.0 7.4 12.5 9.8
Cincinnati Bengals 16 121 70 865 5 118.5 191.5 153.5 7.4 12.0 9.6
Detroit Lions 16 117 83 804 6 116.4 202.4 157.9 7.3 12.7 9.9
Tampa Bay Buccaneers 16 119 91 912 3 109.2 202.2 152.7 6.8 12.6 9.5
Baltimore Ravens 16 101 66 771 5 107.1 174.1 140.1 6.7 10.9 8.8
Carolina Panthers 16 112 67 769 5 106.9 176.9 140.4 6.7 11.1 8.8
Kansas City Chiefs 16 88 54 534 8 103.4 157.4 130.4 6.5 9.8 8.2
Miami Dolphins 16 92 53 664 6 100.5 154.4 126.9 6.3 9.7 7.9
Green Bay Packers 16 118 74 883 2 100.4 180.3 137.3 6.3 11.3 8.6
Atlanta Falcons 16 107 67 704 4 96.4 164.4 129.9 6.0 10.3 8.1
San Diego Chargers 16 99 63 739 3 91.9 160.9 129.4 5.7 10.1 8.1
Cleveland Browns 16 98 68 731 3 91.2 162.1 125.1 5.7 10.1 7.8
Philadelphia Eagles 16 106 62 787 1 82.7 151.7 113.7 5.2 9.5 7.1
New Orleans Saints 16 102 65 560 4 82.0 147.0 114.5 5.1 9.2 7.2
St. Louis Rams 16 109 66 707 2 80.8 147.8 113.8 5.1 9.2 7.1
Houston Texans 16 97 56 621 4 80.1 139.1 108.1 5.0 8.7 6.8
Buffalo Bills 16 96 56 504 2 60.4 117.4 88.4 3.8 7.3 5.5
Provided by Pro-Football-Reference.com: View Original Table
Generated 9/1/2015.


As if Gronk weren't valuable enough, he also gets 4 games this season against teams who were in the Top 5 for easiest matchups against TEs. Of course, he'll also be playing 3 against the 2 toughest TE matchups in the league. Just like with the red zone data, we'll be updating matchup data for 2015 in the fantasy section, so check these tables every week and adjust your lineup accordingly

7. Don't Worry, We Didn't Forget About Daily Fantasy

If you're using a Daily Fantasy site to play fantasy football without putting too much strain on your attention span, don't worry. We've got both FanDuel and DraftKings numbers in the database too. So all those nifty searches I showed you in the Season Finder and Game Finder? You can do those with Daily Fantasy points too! Here, for example, is every player with 8 or more games worth 20 points or more in DraftKings:

Rk Year Tm W L T W-L% Count
1 Antonio Brown 2014 PIT 10 3 0 0.769 13
2 DeMarco Murray 2014 DAL 10 3 0 0.769 13
3 Andrew Luck 2014 IND 8 3 0 0.727 11
4 Peyton Manning 2014 DEN 8 3 0 0.727 11
5 Demaryius Thomas 2014 DEN 8 3 0 0.727 11
6 Matt Forte 2014 CHI 3 7 0 0.300 10
7 Aaron Rodgers 2014 GNB 9 1 0 0.900 10
8 Drew Brees 2014 NOR 5 4 0 0.556 9
9 Emmanuel Sanders 2014 DEN 5 4 0 0.556 9
10 Odell Beckham 2014 NYG 3 5 0 0.375 8
11 Le'Veon Bell 2014 PIT 7 1 0 0.875 8
12 Tom Brady 2014 NWE 8 0 0 1.000 8
13 Dez Bryant 2014 DAL 8 0 0 1.000 8
14 Julio Jones 2014 ATL 5 3 0 0.625 8
15 Tony Romo 2014 DAL 8 0 0 1.000 8
Provided by Pro-Football-Reference.com: View Original Table
Generated 8/17/2015.


Not only that, but our matchup data includes FanDuel and DraftKings points, as well as standard fantasy, meaning you can pore over those tables and search for the player who makes you a millionaire. Don't forget to check the red zone numbers too!

With Pro Football Reference, and the powerful search tools of the Play Index, you basically have your own front office and scouts. See, I told you we were going to get through this together. Unless you're in my league; in that case, everything I just said is a complete lie and you should draft Tebow first overall.

Posted in Advanced Stats, Fantasy, Features, Pro-Football-Reference.com | Comments Off on 7 Ways to Dominate Your Fantasy League with PFR

What is the Little League Home Run?

13th August 2015

What is your favorite kind of baseball play? I imagine a lot of people would go with a classic like the dinger. Or perhaps you prefer the swinging strikeout? I imagine Red Sox fans who were in Fenway for Game 4 of the 2004 ALCS may be partial to the stolen base. No matter what it is, I'm very jealous of you, because your favorite play has an easily understood definition and mine does not: Read the rest of this entry

Posted in Advanced Stats, Baseball-Reference.com, Polls, Statgeekery | Comments Off on What is the Little League Home Run?

New Team Roster Features

7th May 2015


Just wanted to show off a couple new features that we've recently introduced...


When you find yourself on our team season pages look for the "Game-by-game roster status" links:


roster_status_link


These will bring you to a Roster Status page with a color-coded visualization of each player's roster status for the 82 regular season games, and the playoffs. Designations include Starter, Reserve, DNP, Inactive, and Suspended. Note that a player's status is also noted on boxscores and our player gamelogs. Notable in 2014-15 are the Raptors, Bulls, and Magic, all of whom maintained a stable roster throughout the season. The Sixers page is a lot of fun to look at, too.

We've published these going back to 2013-14, and should hopefully extend that period at some point.


rockets_screenshot


The other new feature is a historical time series of roster continuity for each currently-active franchise. Our accounting begins with 1952-53 given that the season prior is the first for which we have Minutes Played data for every league player.

Several years ago former colleague Neil Paine published some musings on our blog about Team Continuity, and Dean Oliver devotes a couple pages in his Basketball on Paper book in the context of historically bad teams. The Spurs are well-noted stalwarts of year-to-year stability - on the other hand, the Cavaliers and Mavericks show that it's possible to turn over most of your minutes and not come apart at the seams, especially if one of your newcomers is LeBron James.

You can find a link to this page on our Frivolous Pages index, under Roster Continuity.


continuity


Posted in Advanced Stats, Announcement, Basketball-Reference.com, CBB at Sports Reference, Data | Comments Off on New Team Roster Features

Heinie Zimmerman wins the retro-active 1912 NL Triple Crown

5th March 2015

One of the things I love about SABR is how dedicated (and borderline crazy) some of the researchers are and how their years and years of work can bear fruit in unexpected ways. (I'm sure I love it because I have more than a bit of that in me as well.) In next month's Baseball Research Journal, an article by Herm Krabbenhoft will show that Heinie Zimmerman had the highest RBI total in the 1912 NL, and when paired with his undisputed batting title and 14 home runs, he won the triple crown.
Read the rest of this entry

Posted in Advanced Stats, Announcement, Baseball-Reference.com, Statgeekery | 8 Comments »

Adding Box Plus/Minus (BPM) to College Basketball

11th February 2015

Just a note that we have added Box Plus/Minus (BPM) to our College Basketball site this week.

As outlined in its introduction to Basketball Reference, BPM is an advanced stat intended to measure a player's total contribution as reflected by advanced, context-dependent box-score metrics like USG% and AST%. It was developed for the NBA using regression techniques against a 14-year-long sample of historical Regularized Adjusted Plus-Minus (RAPM) data. BPM estimates the number of points contributed by a player greater or less than an average player, per 100 team possessions.

We're able to calculate BPM for seasons dating back to 2010-11 and it can be found initially on player pages in the 'Advanced' table, on our school season pages, also in the 'Advanced' table, and we've also added several advanced stats - including PER, Win Shares, and BPM - to the conference registers, along the right side of that page. (see below image). However, the best way to view BPM, as a sorted leaderboard, or according to any other criteria - is to use our Play Index search tools.


bpm_cbb


Again, our thanks to the creator of BPM, Daniel Myers, and to those whose work serves as a component. The methodology and logic of Box Plus/Minus (BPM) is discussed in our About section, and please note the section specifically for the NCAA.


(Note that the 'Advanced' tables on the player and schools pages have changed just a little, to accommodate the new stats. Individual ORtg and DRtg have been moved to the 'Per 100 Possessions' tables and Points Produced - the main component of ORtg - has been moved further to the left on the 'Advanced' table.)


* We have published BPM but not VORP for college basketball, unlike the NBA.  Value over Replacement Player (VORP) owes its meaning and derivation to a market with salaried players and teams on an equal footing, and thus an easy-to-establish theoretical "replacement level", which doesn't exist or make sense for the NCAA.


Posted in Advanced Stats, Announcement, Basketball-Reference.com, CBB at Sports Reference | Comments Off on Adding Box Plus/Minus (BPM) to College Basketball