Sports Reference Blog

Archive for the 'Advanced Stats' Category

Box Plus Minus/VORP for the Playoffs

9th February 2015


Playoff Box Plus/Minus (BPM)

We're now able to calculate Box Plus/Minus (BPM) and Value Over Replacement Player (VORP) for the playoffs, by extending the methodology used for the regular season, and calculating a team efficiency rating based on performance in the playoffs, adjusted for strength of playoff lineups (by using playoffs minute distributions and regular season BPM ratings). These ratings are interesting in themselves, and reflect some of the great playoffs runs - the 1996 Bulls' rating was +19.3, and the 2001 Lakers were +20.1.

The BPM figures themselves reflect the best individual playoff performances. LeBron's 2009 BPM of 18.2 is tops by a large margin, followed by Kareem's 1977 run and then the Jordan playoffs from 1989-1991.

(For a detailed explanation and further discussion see the "Playoff Box Plus/Minus and VORP" section of the write-up.)


Playoff VORP (and Pro-Rating the Regular Season)

As well as BPM, we can now calculate VORP for the playoff season. (If you need a refresher on VORP as a concept, please visit the original write-up when we introduced it to Basketball Reference). We calculate VORP for the playoffs similarly to the regular season - that is, [BPM - (-2.0)] * (% of minutes played) - and it should be interpreted identically. Again, that's as the number of points the player has produced over a replacement player, per 100 team possessions.  The significance of VORP compared to BPM is that it's accumulative, rather than a rate stat, and thus accounts more literally for value provided, weighted as it is by minutes played, and expressed on a per-82 game basis*.

(* - Yes, this is new. We are now pro-rating VORP based on the number of games that a team has played during the regular season, and doing the same for the playoffs. One point of VORP is one point of full season team efficiency differential. This affects partial seasons, strike-shortened seasons, and the playoffs.  This has significance for the playoffs, in particular - players on teams that go further or play in 7-game series will accumulate more because they have more opportunities.)


Some Minor Changes to the Equation

Please note that we've also updated the methodology, such that some players will have a slight variation in the BPM and associated stats. These were technical fixes to the regression methodology, which had the result of slightly changing the relative value of component stats. For example, blocks and shooting efficiency are two factors that are more highly favored by the revision and thus Anthony Davis saw the largest increase in BPM (+0.8), however most changes were of a much smaller magnitude. Please see the details of this revision in the write-up, under the "Updates" section.


Again, Basketball Reference extends its thanks to Daniel Myers, whose research the above represents. Also, please see the revised 'About BPM' write-up that details the methodology and is generally extremely useful for understanding the context of BPM and VORP, and the best ways to think about and use these stats.


Posted in Advanced Stats, Announcement, Basketball-Reference.com, CBB at Sports Reference, Playoffs | 2 Comments »

Small Additions to the Player Season Finder

6th January 2015

Just a note that we've added 3-Point Attempt Rate (3PAr) and Free Throw Attempt Rate (FTr) to our Player Season Finder.

In addition, we've expanded the group of shooting stats that we show by default, now including both eFG% and TS%.

This should help you keep tabs on Kyle Korver's historic sharpshooting...


psl_new_stats2


Posted in Advanced Stats, Announcement, Basketball-Reference.com, CBB at Sports Reference | Comments Off on Small Additions to the Player Season Finder

Games Started, Quality Starts on Hockey-Reference.com

9th December 2014

We've added four new measures to goalies on Hockey-Reference.com, Games StartedQuality Starts, Quality Start Percentage, Really Bad Starts. These should be available anywhere you see goalie stats on the site currently, including the Play Indexes.

Games Started (GS) should be fairly obvious, this is the number of games that a goalie started (i.e. did not come in for another pulled goalie).

Quality Starts and Quality Start Percentage were developed by Rob Vollman, and are described in his Hockey Abstract. Here is a brief description, but we encourage you to pick up a copy of his book for additional discussion of this statistic (and many others):

Quality Start (QS) is when the goalie achieves at least the mean save percentage (for the season) in a game. For the 2013-2014 season that percentage is 91.5%. So, if Tuukka Rask allows only 2 goals on 28 shots (a 92.9% save percentage), that is considered a Quality Start. There is an additional criteria for low shooting games: if a goalie faces 20 or fewer shots, he only needs to get an 88.5% save percentage. The relationship between save percentage and winning percentage (and hence the definition of Quality Start) is shown here (prior to 2009-2010):

Save % Win %
0.913 or better 0.777
0.900 to 0.912 0.536
0.885 to 0.899 0.503
0.884 or worse 0.246

Quality Start Percentage (QS%) is simply the number of Quality Starts / Games Started. This gives you a sense of how often the goalie has a Quality Start. A good rule of thumb for this stat is that anything less than 50% is bad, anything over 60% is among the league leaders, and the league average for an NHL regular is about 53.4%. Also, according to Vollman: "Based on the average of every goalie with fewer than ten starts in a season, the average for replacement -level goalies is 42.8% but, in fairness, there is some selectino bias involved in this since playing that poorly will generally limit you to ten start in the first place."¹

Really Bad Starts (RBS) is another stat coined by Vollman that is "awarded" whenever a goalie has a save percentage in a game less than 85%. A team only has a 10% chance of winning when the goalie has save percentage that low.

Where to find these new stats

"So," you are asking, "where do I find these new stats?" They are available anywhere goalie stats have been listed on the site. Due to a limitation of our data source, they are only available going back to the 2007-08 season. So, if you go to a goalie page, you'll see the stats listed in the NHL Standard and NHL Playoffs sections.

Additionally, you can see the league-wide stats on the yearly page for a league. For instance, the 2015 stats are available here.

Finally, the stats are available on the Player Season Finder for goalies and the Player Playoff Finder for goalies.

As always, we welcome any feedback.

Posted in Advanced Stats, Announcement, Hockey-Reference.com | 2 Comments »

Advanced Stats Added to Team Game Finder

24th November 2014

Users of our Play Index have likely grown accustomed to searching through the Team Game Finder to find things like highest-scoring games or best shooting performances. However, over the years basketball fans (and our users) have grown more statistically savvy and often crave a deeper perspective beyond the raw numbers. For that reason, we have included an advanced box score within our games boxes for some time. Now, we have taken the next step by allowing users to search through these advanced statistics via the Team Game Finder.

To use these tools, you can simply go to the link above and set the parameters you would like for your search. Please note that these advanced stat searches are limited to the era for which we have complete box scores (since 1985-86). Here are some examples:

Please note that cumulative searches utilizing possession-based metrics will differ slightly from some season totals found on team pages and in the team season finder because our box scores have player turnovers, but not team turnovers, which causes slight variations.

Posted in Advanced Stats, Announcement, Basketball-Reference.com, Data, Play Index | Comments Off on Advanced Stats Added to Team Game Finder

Player Season Finder Improvements, Including BPM & VORP

13th November 2014

Just a note that we've expanded the searchable options in our Player Season Finder this week.

In particular, we've added BPM and VORP to the list of searchable stats, both of which are available going back to the 1973-74 season.  If you don't know what those stats are, you may have missed this recent announcement. Also feel free to weigh in at the discussion on the APBRmetrics forum.

Also, we've added search options by a player's birth state, college, and debut seasons, either in the NBA or ABA. There's also a new option to search by award winners so you can see all seasons by MVP winners, All-NBA selections, Defensive Players of the Year, etc.

If you're new to the site, the Player Season Finder is our most popular database search tool. You can get to it by clicking on 'play-index' in the top navigation menu, then the large 'Player Season Finder' link. It allows you to search for and compare player stats for a season or a player's career (or a span of years). You can also find the number of seasons that match your criteria. As an example, you can find the highest USG% seasons of all timemost career VORP for a player from Duke, or the most points scored in a single postseason.

The new fields are highlighted in red below:


psl_new

Posted in Advanced Stats, Announcement, Basketball-Reference.com, CBB at Sports Reference | 2 Comments »

The Relationship Between SRS and NFL Ticket Prices

20th October 2014

The home viewing experience for NFL games is the best it’s ever been. With that, the process of going to a game on Sunday can be a bigger hassle when factoring in all parts of the Fan Cost Index. Some struggles to bring fans to the games lead to things like a fantasy football section in the stadium or poolside cabanas in Jacksonville. On the secondary ticket market, there’s a few different factors that set the level of demand for NFL tickets. Market size will always be one of the biggest factors, as is quality of competition on a game by game basis. One thing the team itself can control to typically keep demand high is presenting a good on field product.

Using the past five seasons of TiqIQ secondary market data and the past five years of team SRS, we can see which teams have the strongest correlation of ticket prices to team success. After running the numbers, 12 teams came out with a correlation of .4 or higher. Another seven teams had a negative correlation of -.4 or below.

The strongest positive correlation came from the Denver Broncos at .99. The average price for Broncos tickets has risen every season since 2010, as has their SRS. In 2010 the Broncos had an SRS of -8.9, an average home price of $120.66 and Kyle Orton at quarterback. This season, the Broncos have an average home price of $339.71 as they are again one of the top teams in the NFL with Peyton Manning. The $339.71 average price is the fifth highest in the league this season.

New Orleans, Washington and Seattle were the only three other teams to have a correlation above .7. Seahawks tickets follow a similar trend to the Broncos. In 2010 the Seahawks had an SRS of -9.4 and a season average on the secondary market below $100. This season, the average price for a home game in Seattle is $398.51, the most expensive price in the league.

Cowboys tickets had the fifth strongest correlation at .69. While the average price for a home game at AT&T Stadium is usually among the top half of the league, the actual average has risen and dipped with the team’s performance. Unsurprisingly, the $260.23 average price at AT&T Stadium is the most expensive over the past five years.

The strongest negative correlation came from teams that have not been particularly good over the past five seasons — the Tennessee Titans, Oakland Raiders, Tampa Bay Buccaneers and Jacksonville Jaguars. The most interesting team in the bottom five is the Atlanta Falcons. The price of Falcons tickets on the secondary market have remained consistent — around a $130 to $150 average price through the years atop the NFC South and the struggles over the past two seasons.

Posted in Advanced Stats, Announcement, Pro-Football-Reference.com | Comments Off on The Relationship Between SRS and NFL Ticket Prices

Play Index Tools Now with Short Surveys & no Ads

8th October 2014

Since we've launched the various Play Index tools on our sites, we've struggled with the best way to monetize what we feel is the deepest and most powerful set of sports data tools anywhere. We know they are useful, our users, the teams, broadcast networks, and newspaper reporters tell us so.

On baseball, we charge an annual fee of $36, but our best guess is that the traffic and audience of the other sites would not be sufficient to make a subscription model worth our while. We have been running traditional banner ads on those pages, but they pay so little and the play index content is niche content (valuable, but niche content) so the traffic will never rise that high on the play index pages. So we have decided to remove all banner advertising and instead run Google consumer surveys on the non-baseball play index pages.

Here's how it works. The first time you run a report each day your results will be obscured and you will be asked to answer a 1-5 question survey. After you answer the survey, your requested report will be shown to you and you won't see another survey for that site on that browser for 24 hours (multi-question surveys are good for 48 hours). These surveys pay us around 5 cents per survey which, while it doesn't sound like much, is about 15 times what we would get from banner ads on those pages. Here is an FAQ if you are wondering how Google uses this information.

Also, if you find these gateway surveys a step too far, consider subscribing to our Ad-Free Access. Starting at $20/year you can surf every Sports Reference page ad and survey free.

If you are wondering what our play index tools are, give them a try. We think you'll enjoy them.
Play Index at Basketball-Reference.com
Play Index at Pro-Football-Reference.com
Play Index at Hockey-Reference.com
Play Index at Sports-Reference.com/cbb
Play Index at Sports-Reference.com/cfb

Posted in Advanced Stats, Announcement, Basketball-Reference.com, CBB at Sports Reference, CFB at Sports Reference, Hockey-Reference.com, Pro-Football-Reference.com | Comments Off on Play Index Tools Now with Short Surveys & no Ads

Introducing Shooting Splits With Particular Lineups

8th October 2014

Earlier this week we introduced new advanced search options into our shooting splits tool.

In case you didn't know before, we have detailed shooting data for every player since 2000-01, and detailed splits are available by going to a player's page and hovering your mouse cursor over 'Shooting':


shooting_link2


Now, you can click on the [+] next to 'show advanced options' and you'll see two new advanced tools.

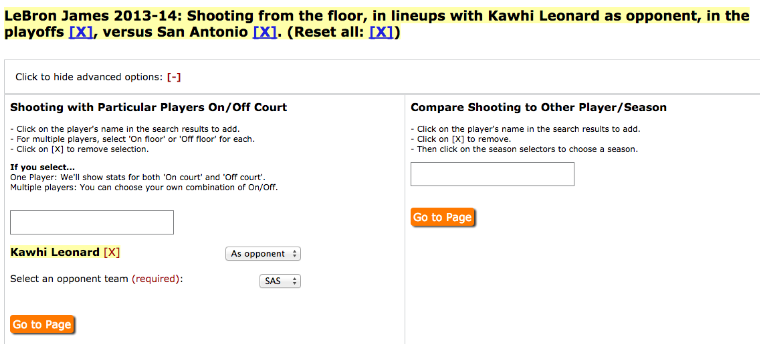
On the left, type in a player's name and click the search result to add it. In most cases, it will automatically populate as 'As teammate' or 'As opponent'. This will show shooting splits for whoever's page you are on, with the selected player both on and off the court.

In fact, you can even add several players and select custom combinations of 'On' and 'Off'.

Check out how LeBron fared versus Kawhi Leonard in 2013-14 by adding Leonard's name, then clicking on 'Go to Page'.

You can check out the numbers for just the Finals by clicking on the 'Playoffs' link in the results (likewise, you can add any split to your query the same way).


shooting_splits

adv_options


Why did Ruben Patterson call himself "Kobe Stopper". It might be these 2001-2002 numbers when Kobe went 18-63 with Patterson on the court, then 46-96 with him off:

 
ruben_p2


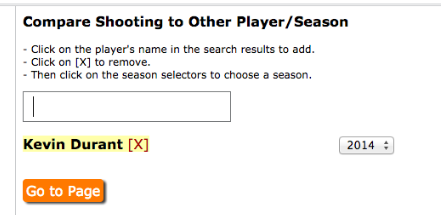
ALSO! The tool on the right lets you compare the player whose page you are on versus any other player, or any other season. It works the same way, that is, begin typing the name in the form and then click a season from the select box that appears.

Then click 'Go to Page' and you'll get a side-by-side comparison of that player's shooting splits versus his own or another player's, in whichever season you selected:


duranke01


Posted in Advanced Stats, Announcement, Basketball-Reference.com, CBB at Sports Reference | 3 Comments »

Super Detailed Post Season Game Previews

30th September 2014

Game Previews - Baseball-Reference.com

Every possible pitcher batter matchup is detailed along with a host of other details.

Posted in Advanced Stats, Announcement, Baseball-Reference.com | 2 Comments »

Situational Rate Stats on Hockey-Reference.com

25th September 2014

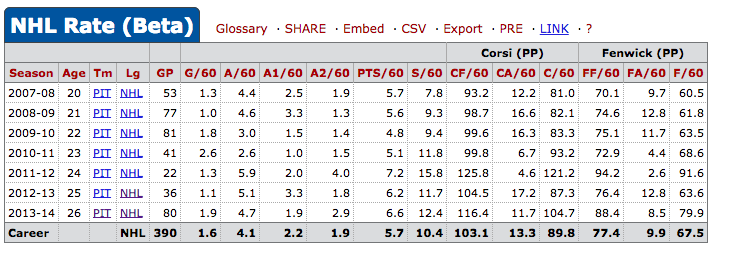
As part of our plan to continue to add "advanced" stats to the site, we've included new rate stats on the "Additional Stats" pages for players. These new stats are primarily "per 60 minutes" versions of already existing stats, but we also have included a break out of assists to include both 1st and 2nd assists per 60 minutes. The advantage of the "per 60" versions of these stats is that it makes it easier to compare players with wildly varying amounts of ice time.


Screen Shot 2014-09-25 at 8.14.59 AM

These stats are available by clicking on the "Additional Stats" link on the player pages:

Screen Shot 2014-06-05 at 3.26.02 PM

As always, we appreciate any feedback or questions.

Posted in Advanced Stats, Announcement, Hockey-Reference.com | 4 Comments »