9th June 2015
Hockey-reference.com has added a section called "Amateurs," that contains information on Amateur Teams with alumni in the NHL.
The landing page for "Amateurs" shows all NCAA, Major Junior and Canadian College (CIS) teams with an alumnus who played in the NHL. Clicking on those teams will show a list of all alumni, and their career NHL stats.
For example, the major teams with the most alumni in the NHL are the Kitchener Rangers and Peterborough Petes. The NCAA teams with the most are Minnesota and Michigan.
In addition, each player page now displays which amateur teams that player played for, hyper-linked to that team page showing all of its alumni.
Please keep your eyes peeled for further updates built off of this data.
Posted in Announcement, Data, Features, History, Hockey-Reference.com | Comments Off on Hockey Reference Adds Amateur Alumni Info
8th June 2015
Hockey-reference.com has added a tab to each season page, showing the list of captains for each team.
In addition, the captain is now indicated in each team's roster, for any season, with a "C" next to their name.
The current list of all captains can be found here.
The captains for any particular season can be found, for example, here. To see a different season of captains, just change the year in the URL or use the next/previous seasons links on the page.
Each franchise also has a page which shows their all-time captains. For example, the Chicago Blackhawks' is here.
We've long had this info, but we hope these tweaks and additional pages make this info easier to access.
Posted in Announcement, Features, History, Hockey-Reference.com | Comments Off on Hockey Reference Adds Captains Index & Pages
28th May 2015
We're excited to introduce a new resource for our users to enjoy during the Stanley Cup Playoffs. This new feature contains a game-by-game breakdown of how teams in any given situation fare in Best-of-7 series.
The page consists of a series of tables. The first one shows the home team's record in any given game of a series:
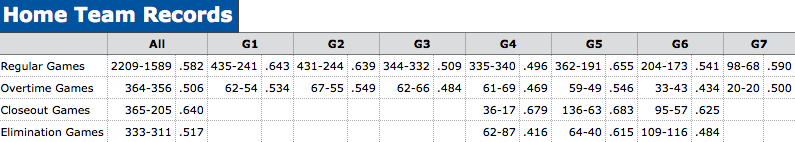
Regular games & overtime games are self explanatory. Closeout games cover any game in which a team has a chance to clinch the series. Elimination games are games in which a team is facing elimination. All Game 7s are both closeout games & elimination games, so we have zeroed out those rows.
The second table is a little more complicated, but features some really cool information once you get acquainted with how to read it. Using this table, you can see how a team's historical odds of winning a given series change with each passing game. For instance, road teams that win Game 6 to tie a series at 3-3, have gone 34-23 in Game 7. Teams that take a 2-0 series lead go on to win the series 87.0% of the time, etc. This table contains the history of every position a team could be in in a Best-of-7 series.
Beneath that behemoth of a table is a simple table with every franchise's record in Best-of-7 series. It's sortable, so you can see that the Canadiens have won the most series and that the Oilers have the best series win percentage.
Finally, the fourth table features every franchise's record in the all-important seventh game. The data is broken down into overall record, home record and away record. Of particular note, with a home Game 7 looming for the Rangers, is that their 7-0 record is home Game 7s is the best in NHL history. You'll also notice that the accompanying winning percentages contain hyperlinks. If you click on those links, they will bring you Play Index query results listing each of those games. So you can easily see all 7 of those Rangers home Game 7s, and then click through to the box scores, as well.
We also wanted to give quick mention to a few other recent additions, in case you missed them:
All-time comebacks from down 3-0 or 3-1
Every Overtime Goal in NHL Stanley Cup Playoffs history
We hope you all can enjoy this new feature as much as we already are at the office. And enjoy what's left of the 2015 Stanley Cup Playoffs.
Posted in Announcement, Data, Features, History, Hockey-Reference.com, Playoffs | 1 Comment »
20th May 2015
We just wanted to quickly point out that we have added a new Frivolity to the site: Teams to win a Best-of-7 series after trailing 3-0 or 3-1. The Rangers recent comeback against the Capitals got us thinking about this, so we figured we'd add the list. Please stay tuned for more cool Best-of-7 series features like this in the feature.
Posted in Announcement, Data, History, Hockey-Reference.com, Playoffs | 3 Comments »
20th April 2015
We just wanted to briefly mention that we have recently added every overtime goal in the history of the Stanley Cup Playoffs to our Frivolities section here. This section currently contains two tables. The first shows the goal scorer, date, team, opponent, OT sessions, final score and how much time had elapsed in the OT periods at the time of the goal. The columns in the table are all sortable in case you'd like to quickly look at OT goals scored for or against your favorite team or find the shortest/longest OT games.
The table on the right, meanwhile, lists the all-time individual leaders in playoff OT goals.
It should be mentioned that this is a comprehensive list of OT goals in Stanley Cup Playoff games between two NHL teams. It does not, however, include games featuring the NHL against the WCHL or PCHA. You may also notice a couple instances where the "winning" OT goal merely tied the game. This is because some early playoff series were determined by total goals, so a game a team held a lead in could go to OT in order to determine the series winner.
Posted in Announcement, Data, Features, History, Hockey-Reference.com, Playoffs | Comments Off on Every OT Goal in Stanley Cup Playoffs History
15th April 2015
With playoffs season upon, we wanted to point out our 2015 NHL Stanley Cup Playoffs section. While it's mostly a shell right now, it will be a good bookmark for info as the playoffs get going. You can find schedule & results for every game, stats for every skater, goalie & team, as well as leaderboards.
There are also series preview pages to see how opponents match up with each other.
If you're more of a history buff, you can also take a skate down memory lane by checking out past playoff seasons, such as 2014 or 2013. Stats for series are also available, such as the 2013 Stanley Cup Final. Links to all playoff seasons (and a list of champions, runners-up and Conn Smythe winners) are available here.
Other Stanley Cup Playoff resources include our all-time Leaders & Records section, list of frequent champions and our Player Playoff Finder tool. With the Player Playoff Finder, you can run all sorts of custom queries such as leading goal scorers, assists leaders, short-handed goal leaders and many others.
Our Team Game Finder & Player Game Finder also contain options to restrict your searches to playoff games only. You can search for things such as the most recent playoff hat tricks & team records in their playoff openers. It should be noted that our player game logs currently go back to the 1988 Playoffs.
We hope you enjoy these features and please let us know what you'd like to see in the future.
Posted in Announcement, Features, History, Hockey-Reference.com, Play Index, Playoffs | Comments Off on 2015 Stanley Cup Playoffs Section
10th March 2015
We've added a page on Hockey-Reference.com that shows the most teams played for in one season, and the most in one career. This table is available via our frivolities section, which can be accessed via the "more" tab towards the top right of the page underneath the search bar.
This list was inspired by Marc Arcobello's "accomplishment" this season. Arcobello recently became just the third player in NHL history to play for four teams in one season. Arcobello, who is a Yale graduate, got off to a hot start with his fourth team, Arizona, with 5 goals in his first 7 games.
He does have some work to do, however, in getting on the other "most played for" list. Mike Sillinger leads that with 12 different teams played for in his career.
Posted in Announcement, Data, Features, Hockey-Reference.com | Comments Off on Most hockey teams played for in 1 year?
9th March 2015
Hockey Reference has added a feature popular with some of the other sites in the Sports Reference family.
Now, if you go to a player's Game Logs page, you can click two different rows and get cumulative statistics for that player just within that range.
For example, from any player's page, click the "Game Logs" tab. That will show the player's game-by-game statistics for the given season. Click on one game, then click on another. A window will pop up showing the player's cumulative statistics in that span.
This is handy for all sorts of purposes. Please let us know if you have any questions or additional feedback about this tool.
Posted in Announcement, Features, Hockey-Reference.com, Tips and Tricks | 2 Comments »
3rd March 2015
One of the more common subjects for queries we receive at Sports-Reference is our SRS (Simple Rating System) figures. For some background, the first of our sites to add SRS was Pro-Football-Reference, when Doug Drinen added it to the site in 2006 and provided this excellent primer. The important thing to know is that SRS is a rating that takes into account average point differential and strength of schedule. For instance, the 2006-07 Spurs won games by an average of 8.43 points per game and played a schedule with opponents that were 0.08 points worse than average, giving them an SRS of 8.35. This means they were 8.35 points better than an average team. An average team would have an SRS of 0.0. The calculation can be complicated, but the premise is simple and it produces easily interpreted results.
However, there are some variations in the way we calculate SRS across our various sites. We'll break down these differences below.
Pro-Football-Reference.com SRS: PFR's SRS is unique in that a home-field advantage is included as a part of the calculation because of the short schedule compared to the other sports (we don't want a team to look relatively weak at the halfway point because they've only played 3 of their first 8 at home, for instance). This HFA fluctuates yearly based on game results, but it is generally somewhere between 2 and 3 points (2006 being an outlier, as you'll see). Below is a look at the HFA numbers we have used since 2001. If you'd like to calculate these HFAs yourself, just sum up every team's home point differential and then divide by the total number of games played across the league that season. This data can easily be found in the Play Index for each season:
- 2001: 2.0081
- 2002: 2.2461
- 2003: 3.5547
- 2004: 2.5078
- 2005: 3.6484
- 2006: 0.8477
- 2007: 2.8672
- 2008: 2.5586
- 2009: 2.2070
- 2010: 1.8945
- 2011: 3.2656
- 2012: 2.4336
- 2013: 3.1055
- 2014: 2.4883
College Football SRS: Our CFB SRS does not contain a home-field advantage element, but it does have some other quirks. Most importantly, we have capped the margin of victory considered for the formula. Due to the number of mismatches seen in college football, the maximum point differential a team can be credited with in a game is 24. We also credit all wins as a minimum of plus-7 margin of victory (so if you win by 1 point, it's treated the same as a 7-point win). The same logic is applied to losses, as well. One other wrinkle for CFB is that all non-major opponents are included as one team for the sake of the ratings.
College Basketball SRS: SRS for college hoops is straight forward (no HFA & no adjusted MOV), but one item to note is that games against non-major opponents are not counted in our calculations.
MLB, NBA & NHL: All of these SRS calculations are straight forward with no adjustments for HFA and no capping of MOV. It should be noted, however, that no special consideration is given for extra-innings, overtimes or shootouts, either.
We'll close with a quick rundown of the various merits and weaknesses of SRS, from Drinen's original 2006 post. These bullet points were created to describe the system used for NFL SRS, but many of the strengths and weaknesses can applied to the other sports, as well:
- The numbers it spits out are easy to interpret - if Team A's rating is 3 bigger than Team B's, this means that the system thinks Team A is 3 points better than Team B. With most ranking algorithms, the numbers that come out have no real meaning that can be translated into an English sentence. With this system, the units are easy to understand.
- It is a predictive system rather than a retrodictive system - this is a very important distinction. You can use these ratings to answer the question: which team is stronger? I.e. which team is more likely to win a game tomorrow? Or you can use them to answer the question: which of these teams accomplished more in the past? Some systems answer the first questions more accurately; they are called predictive systems. Others answer the latter question more accurately; they are called retrodictive systems. As it turns out, this is a pretty good predictive system. For the reasons described below, it is not a good retrodictive system.
- It weights all games equally - every football fan knows that the Colts' week 17 game against Arizona was a meaningless exhibition, but the algorithm gives it the same weight as all the rest of the games.
- It weights all points equally, and therefore ignores wins and losses - take a look at the Colts season. If you take away 10 points in week 3 and give them back 10 points in week 4, you've just changed their record, but you haven't changed their rating at all. If you take away 10 points in week 3 and give back 20 points in week 4, you have made their record worse but their rating better. Most football fans put a high premium on the few points that move you from a 3-point loss to a 3-point win and almost no weight on the many points that move you from a 20-point win to a 50-point win.
- It is easily impressed by blowout victories - this system thinks a 50-point win and a 10-point loss is preferable to two 14-point wins. Most fans would disagree with that assessment.
- It is slightly biased toward offensive-minded teams - because it considers point margins instead of point ratios, it treats a 50-30 win as more impressive than a 17-0 win. Again, this is an assessment that most fans would disagree with.
- This should go without saying, but - I'll say it anyway. The system does not take into account injuries, weather conditions, yardage gained, the importance of the game, whether it was a Monday Night game or not, whether the quarterback's grandmother was sick, or anything else besides points scored and points allowed.
Posted in Announcement, Baseball-Reference.com, Basketball-Reference.com, CBB at Sports Reference, CFB at Sports Reference, Data, FAQ, Features, Hockey-Reference.com, Pro-Football-Reference.com, SRS, Stat Questions, Statgeekery, Uncategorized | 2 Comments »

We're Social...for Statheads
Every Sports Reference Social Media Account
Site Last Updated: Friday, May 1, 2:56PM
Question, Comment, Feedback, or Correction?
Subscribe to our Free Email Newsletter
Do you have a sports website? Or write about sports? We have tools and resources that can help you use sports data. Find out more.