If you're viewing this site on Internet Explorer 11, chances are you're having a frustrating experience. In recent weeks, we've received voluminous feedback about our sites not loading properly. The common denominator to this feedback is that the users are almost all part of the small portion of our traffic from users on IE11. It seems that IE11 is unable to render many of our pages, probably due to some ad code. Nothing we have tried so far to resolve this seems to have worked. To fix this issue, we may try removing ads on IE11 to see if performance improves. As we're dependent on advertising to keep our sites afloat, this isn't a decision we relish.
Until we figure out what the issue is, we highly recommend user a superior (and free!) browser such as Google Chrome or Firefox.
We're excited to post the latest video in our How To series, showing you some secrets and hacks that will help to get the most out of the Sports-Reference family of sites. Today's video is all about sharing. While many users know how to find the data they're look for, fewer know the different ways of sharing it. From embedding tables on a website or blog, to posting them to Reddit, to downloading directly to your computer as a spreadsheet, this video will show you the different ways that you share all the info you find on our sites:
We know that a lot of you are interested in grabbing data from our site and reusing it in excel and generating reports on your own. We got our start doing that.
The redesign complicates that because we add some helper elements to the page that are relevant for the vast majority of users and helpful in their use of the site. I'll call this material Mobile Formatting. It includes the frozen left column on wide tables, the max width of the page and side scrolling, the use of interior table header rows and sort direction indicators. So to make sorting easier, I've added an option to the "Share & more" menu to strip this content out in one click. Read the rest of this entry
On the old version of the site on the front page, we placed the cursor into the search box automatically which could cause some issues if you had already scrolled down the page. Your browser would then be jerked back to the top of the page. On the site redesign, all you have to do is (once the page has loaded) hit the tab key one time and you'll be put into the search box. Lickety Split.
Today, the automatic Excel export feature has returned to all of our sites. To export any of our tables to Excel, please hover over "Share & more" above the table you'd like to export. Once you hover, you'll see a dropdown where you can select "Get as Excel Workbook (experimental)", which will download the table into an xls file you can open with Excel.
I'd estimate that around 99% of the time, when someone comes to a Sports Reference site, they go to a player or team page and then log off. More advanced users may find their way to the frivolities pages, experiment with features like the Oracle of Baseball, or just spend several hours following link chains to various players and games.
But, just like Westworld, there's another level to our websites, one that relatively few people know how to navigate. It's called the Play Index and, in all sincerity, figuring out how to use it will change your life as a sports fan. If you've ever wondered how people find tidbits like "Mike Trout has the most WAR of any hitter through age-24" or "Dennis Rodman had seven 0-point, 20-rebound games in his career", the answer is usually that they've used the Play Index.
While the Play Index is easy to use if you know your way around, it can seem daunting to a newcomer. We often get messages from people who are eager to learn how to use the Play Index, but don't quite know where to start. So, with that in mind, we're starting a new video series called Play Index 101! Read the rest of this entry
As you may have noticed, on our re-designed sites we recently disabled the feature allowing you to export our tables directly to Excel. This was because updated browsers were no longer supporting the function and it was becoming problematic to keep up. However, this doesn't mean that you can't still easily export our tables into spreadsheets. There's just an extra step or two, now.
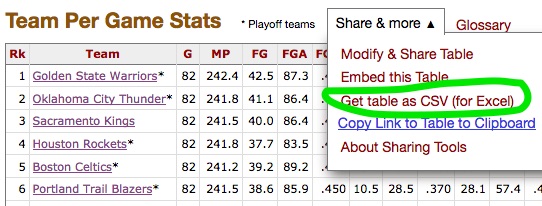
First, look for the "Share & more" tab atop the table you'd like to export. If you don't see this tab, it means the particular table you're looking at isn't exportable. Otherwise, hover over it and options will drop down (see image). Select "Get table as CSV (for Excel)", which will convert the table to comma-separated values.
Once the table has been converted to CSV, copy and paste the entirety of the table (or whatever section of it you want) into Excel, as text. You will now have an unintelligible, single-column mess in your spreadsheet, but that's fine. The commas are there for a reason and Excel will help us easily convert those commas into nice, readable columns of data. This next step is sometimes variable depending on the version of Excel you're working with, but what you want to find is the "text to columns" function. In my Excel for Mac 2011, this can be found under the "Data" tab. If you can't find it on your version, a google search for "Excel text to columns" with your Excel version number should yield useful results.
Once you have located the "text to columns" function, you will choose a file type that best describes your data. You will want to choose "delimited" since the fields are separated by commas. Next, you will choose the delimiter. Check the box next to "comma." Once you make that selection, you can finish up with the text to columns wizard and you should then have a nicely formatted spreadsheet.
We realize this is not quite as quick or simple as the old export function, but unfortunately we can no longer support that function. Once you get the hang of this method, you'll see it's also quite simple.
With tonight's World Series Game 7, we thought we'd post quick links to Play Index searches showing every championship round Game 7 in MLB, NBA and NHL history. The lists are searches for home teams in Game 7s, sorted by date. If you click the date, you can see the box score for the game (when available). Enjoy!
World Series Game 7s (please note that this list is Winner Take All games, rather than Game 7s due to some World Series being longer than 7 games or having 7th games that weren't decisive in the early years)
Good news for fans of zambonis, fighting, and the greatest video game of the 1990s: the NHL has finally returned! After a wild season last year, there are all kinds of juicy storylines to follow this year. Can the Pittsburgh Penguins become the first back-to-back Stanley Cup winners since the Detroit Red Wings of the 1990s? How will the San Jose Sharks bounce back from coming so close and falling short. Will Alex Ovechkin reach 1,000 goals? Can Connor McDavid build upon a promising rookie year and live up to the hype? What round of the Eastern Conference Playoffs will the Washington Capitals be eliminated in this year (I kid, I kid)?
This blog post will seek to answer none of those. Instead, this week, I wanted to dig into one of the major trends that's been sweeping across the NHL the last few years, among fans and front offices alike. I'm talking, of course, about the rise of advanced statistics.
If you're a sports fan, you're probably at least vaguely familiar with Moneyball and the advanced stat wars in baseball. And you may have read articles about how thinkers in other sports, like basketball, have used similar principles to deepen their understanding of the game. This movement has reached hockey in recent years, as researchers have uncovered several new ways of understanding the game beyond the traditional stats like goals, assists, and plus/minus. These new analytics can help us understand why a team is over or under-performing, and whether that performance is sustainable. They can also help us appreciate unsung players who do more for their team than we may realize, because they don't put up flashy traditional numbers.
With the Player Comparison Finder, you can choose anywhere from 2-6 players and compare single seasons, a selection of seasons, or their entire careers.
We're Social...for Statheads
Every Sports Reference Social Media Account
Site Last Updated: Friday, May 1, 2:56PM
Question, Comment, Feedback, or Correction?
Subscribe to our Free Email Newsletter
Do you have a sports website? Or write about sports? We have tools and resources that can help you use sports data. Find out more.