Sports Reference Blog
Inside the Warriors’ Small-Ball Death Star
Posted by Jonah Gardner on December 17, 2015
The first quarter of the 2015-16 NBA season has been dominated by one team: the Golden State Warriors. At 25-1, they've posted the best start in NBA history, with the longest winning streak to start a season and the most wins by a team through its first 26 games. What's transformed the Warriors from an already great team to, potentially, one of the best ever?
You can point to any number of reasons, but a big one is the rise of their unstoppable small-ball lineup. Though an injury to Harrison Barnes caused them to temporarily shelve the lineup, the Warriors' small-ball group has been one of the major stories of the season and figuring out how to stop it will be the main task of any team hoping to unseat the champs. So let's go inside the NBA's equivalent of the Death Star and witness the firepower of this fully armed and operational lineup.

The most common version of the Warriors' small-ball lineup has Stephen Curry at PG, Klay Thompson and Andre Iguodala as wings, Harrison Barnes at PF, and Draymond Green at C. This lineup has been the Warriors' 5th-most used 5-man lineup, logging 64.8 minutes. How have they done in that time? Get your fire emojis ready:
| Poss | Net (Per 100 Possessions) | ||||
|---|---|---|---|---|---|
| Rk | Lineup | Tm | MP | Pace | PTS |
| 1 | H. Barnes | S. Curry | D. Green | A. Iguodala | K. Thompson | GSW | 64.8 | 107.0 | +66.5 |
| 2 | M. Dellavedova | L. James | K. Love | J. Smith | T. Thompson | CLE | 71.5 | 84.0 | +37.5 |
| 3 | S. Curry | F. Ezeli | D. Green | A. Iguodala | K. Thompson | GSW | 91.7 | 101.0 | +34.1 |
| 4 | K. Caldwell-Pope | A. Drummond | R. Jackson | M. Morris | A. Tolliver | DET | 73.4 | 93.9 | +28.6 |
| 5 | S. Hawes | F. Kaminsky | J. Lamb | J. Lin | M. Williams | CHO | 78.9 | 91.3 | +26.5 |
| 6 | L. Deng | G. Dragic | D. Wade | H. Whiteside | J. Winslow | MIA | 74.9 | 97.8 | +26.2 |
| 7 | R. Felton | W. Matthews | D. Nowitzki | Z. Pachulia | D. Williams | DAL | 182.1 | 91.1 | +19.6 |
| 8 | A. Bogut | S. Curry | D. Green | B. Rush | K. Thompson | GSW | 76.2 | 99.2 | +19.5 |
| 9 | B. Griffin | D. Jordan | C. Paul | J. Redick | L. Stephenson | LAC | 147.9 | 97.2 | +18.0 |
| 10 | B. Griffin | W. Johnson | D. Jordan | C. Paul | J. Redick | LAC | 81.9 | 94.3 | +17.1 |
There are 75 5-man lineups that have spent at least 60 minutes together on the floor. Only one of the other 74 manages to come within 30 points per 100 possessions of the Warriors' Death Star.
Now 60 minutes isn't a gigantic sample size for an NBA lineup. Over the course of last season, 259 separate 5-man lineups logged at least 60 minutes together. Our lineup data goes back to the 2000-01, so surely, in that time, one of the 2,000ish lineups to log 60+ minutes had a better net rating? Or at least came close?
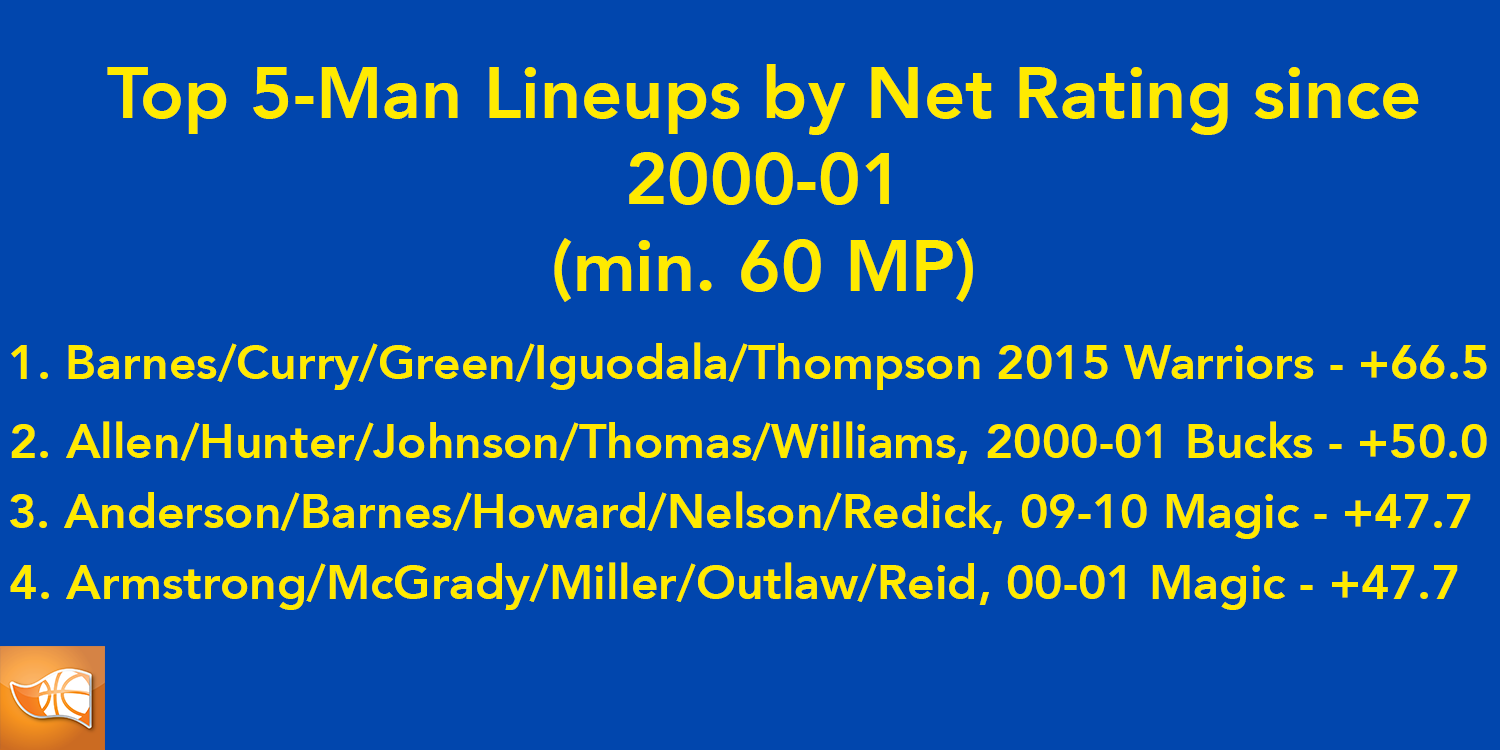
Since the Lineup Finder only searches one year at a time, you'll have to take my word for this (or go year by year like I did). Out of every season since Shaq and Kobe's march to their 1st ring, the closest any 5-man lineup has come to matching the Warriors' Death Star is this Bucks' lineup from the year they took the Sixers to 7 games in the ECF. Even that lineup is 16.5 points per 100 shy of the Warriors. Only 2 other lineups came within 20: a 4-out, 1-in lineup from the Dwight/SVG Magic and a T-Mac lineup from 2000-01.
How are they doing it? It starts with Stephen Curry, who, as you might have heard, is having an OK season. The record for WS/48 is Kareem Abdul-Jabbar's 1971-72 season, when he had .3399. The record for PER? Wilt's 31.82 in 1962-63. Steph is blowing both away:
| Season | Age | Tm | Lg | Pos | G | MP | PER | WS/48 |
|---|---|---|---|---|---|---|---|---|
| 2015-16 | 27 | GSW | NBA | PG | 25 | 873 | 33.7 | .358 |
| Career | NBA | 441 | 15432 | 22.4 | .187 |
If you prefer old-school stats, here's every player to average 33 points per 36 minutes while shooting over 51%:
| Totals | Shooting | ||||||||
|---|---|---|---|---|---|---|---|---|---|
| Rk | Player | Season | Age | Tm | Lg | MP | FG% | TS% | PTS |
| 1 | Stephen Curry | 2015-16 | 27 | GSW | NBA | 873 | .517 | .688 | 33.3 |
| 2 | Wilt Chamberlain* | 1962-63 | 26 | SFW | NBA | 3806 | .528 | .550 | 33.9 |
However, the fulcrum of the Warriors' Death Star may actually be Draymond Green. Green plays center in these lineups, meaning that he's matched up with much taller, heavier players while fighting for rebounds and protecting the rim. Here's every player since 1973 who averaged 9 rebounds and 1.5 blocks per 36 minutes while being listed at 6'7" or shorter (min. 30 MPG):
| Totals | Shooting | Per 36 Minutes | |||||||||||
|---|---|---|---|---|---|---|---|---|---|---|---|---|---|
| Rk | Player | Ht | Season | Age | Tm | G | MP | 3P | 3PA | 3P% | TRB | BLK | MP |
| 1 | Draymond Green | 6-7 | 2015-16 | 25 | GSW | 25 | 868 | 34 | 93 | .366 | 9.0 | 1.6 | 34.7 |
| 2 | Shawn Marion | 6-7 | 2005-06 | 27 | PHO | 81 | 3263 | 96 | 290 | .331 | 10.6 | 1.5 | 40.3 |
| 3 | Charles Barkley* | 6-6 | 1985-86 | 22 | PHI | 80 | 2952 | 17 | 75 | .227 | 12.5 | 1.5 | 36.9 |
| 4 | Terry Tyler | 6-7 | 1978-79 | 22 | DET | 82 | 2560 | 9.1 | 2.8 | 31.2 | |||
| 5 | Lloyd Neal | 6-7 | 1975-76 | 25 | POR | 68 | 2320 | 9.1 | 1.7 | 34.1 | |||
| 6 | Gar Heard | 6-6 | 1974-75 | 26 | BUF | 67 | 2148 | 11.2 | 2.0 | 32.1 | |||
| 7 | Gar Heard | 6-6 | 1973-74 | 25 | BUF | 81 | 2889 | 11.8 | 2.9 | 35.7 | |||
I left in Draymond's 3-point shooting info for a reason. Among the 3 players on that list who we have 3-point stats for, Draymond already has more makes and attempts than Barkley and is averaging more than Marion (1.4-3.9 per 36 for Draymond vs 1.1-3.2 for Marion). As you know, 3-point shooting is way up over the last few years. Here's where things stood entering the season:
This year, teams are shooting 23.8 3s per game, which would again set the record. However, the Warriors small-ball lineup is shooting it more. Way more:
The Warriors' Death Star lineup is making more 3-pointers per 48 minutes than the average NBA team attempts.
Even with a loss, what the Warriors are doing this season is unprecedented. The collision of scheme, talent, and the historic moment have created a team that's on an all-time pace. And, unlike the original Death Star, no one's found a structural weaknesses yet.
If you're interested in exploring the Warriors' dominance further, we've added a section to the home page, just below the rotating leaderboard, that links to some of the historic records they're chasing. And, you can dig through even more data and research, like the lineup data you saw in this post, in the Play Index.

"The City" Death Star Graphic by Sports Reference LLC is licensed under a Creative Commons Attribution 4.0 International License.
Based on a work at http://www.sports-reference.com/blog/2015/12/inside-the-warriors-small-ball-death-star/. We hold no rights to Star Wars™ or the Death Star™ or "The City" logo ™ and are using them here under fair use. We bear no responsibility for any non-sports reference uses of this graphic.
We're Social...for Statheads
Every Sports Reference Social Media Account
Site Last Updated: Friday, May 1, 2:56PM
Question, Comment, Feedback, or Correction?
Subscribe to our Free Email Newsletter
Do you have a sports website? Or write about sports? We have tools and resources that can help you use sports data. Find out more.