14th April 2015
We've made a neat addition to our College Basketball site that we wanted to share with everyone. If you go to our Leaders & Records section, you'll notice that the right column now contains 2 "records" links. These pages contain all-time individual records for NCAA Tournament games and single NCAA Tournaments.
Now you can see that Austin Carr has 3 of the 5 highest scoring games in NCAA Tournament history. And you can even click on the date of the game to check out the box score.
The other option is to look at records for a single tournament run. Glen Rice holds the all-time record for points in a single tournament with 184 in Michigan's run to the 1989 National Championship.
We've added a note to the top of each page to indicate certain limitations of the scope of these statistics. For instance, although the NCAA Tournament has existed since 1939, assists, blocks and steals have only been officially tracked since the mid-1980s.
We hope you all enjoy this new addition.
Posted in Announcement, Basketball-Reference.com, CBB at Sports Reference, Data, Features, History, Leaders | 2 Comments »
13th April 2015
Just a quick programming note as the 2014-15 regular season comes to a close. Late last week we unveiled a new feature in player game logs: DFS scoring. DFS is an abbreviation for "Daily Fantasy Sports" and the column on the far right of the player game logs presents their score for that game on DraftKings.com (a daily fantasy sports site).
This addition allows users to figure out average DFS scores over a range of games as well. For instance, with this search you can see that LeBron's average DFS score was 47.0 before his "vacation." And that Russell Westbrook has averaged 61.4 DFS points since February.
We hope you enjoy this addition, and please let us know if there's any other DFS features you'd like to see.
We'd also like to remind you that a $15 deposit on a new DraftKings account will net you a free year of baseball-reference Play Index access.
Posted in Announcement, Basketball-Reference.com, Data, Features | Comments Off on DraftKings Points Added to Player Game Logs
25th March 2015
Regular visitors to the site have likely noticed a small tweak we recently made to the layout of player pages. The change is the addition of a shortcut to our Player Comparison Finder tool. For instance, from Stephen Curry's page, someone might decide that they want to compare him to James Harden. This can now be done very simply by typing Harden's name into the "compare to" box shown in the image below:

Once you type in Harden's name and click on it, this career comparison page is generated:
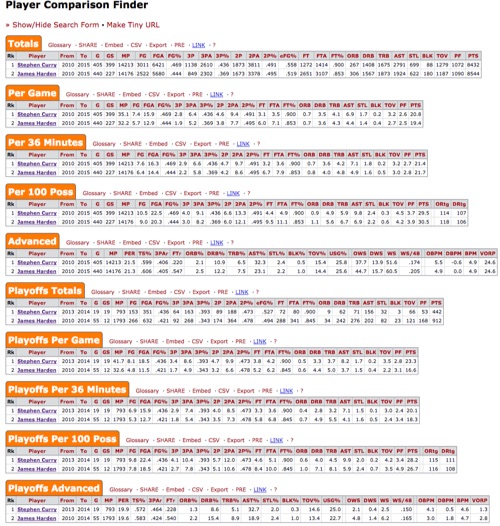
This is the default comparison search, but you can easily edit it to just compare 2014-15 (or any other season(s)). Just click the red "Show/Hide Search Form" link on top of the stat tables to bring up the search form. From there, edit your search to compare "single seasons" in the yellow part of the search form. Then select 2014-15 for both players and click "get results." This will take you to this page, comparing two leading 2014-15 MVP candidates in a variety of statistical categories, from basic to advanced.
As an added bonus, if you go back to the search form, you'll notice there's room for up to 6 players in a comparison. You can go ahead and populate any players you'd like there. For instance, here's 6 leading 2014-15 MVP candidates compared:

We should note to longtime fans of this tool that it is still accessible from the main Play Index page, but we've added this search to player pages as an added convenience.
Posted in Announcement, Basketball-Reference.com, Data, Features, HowTo, Play Index, Tips and Tricks | 1 Comment »
23rd March 2015
We're excited to announce that we have added nearly every box score in ABA history to basketball-reference.com. The ABA ran from 1967-68 to 1975-76, and we now have the boxes for every season except for 1967-68 thanks to the efforts of Michael Hamel, who researched the box scores and has allowed us to use them.
The boxes are accessible from season pages, team schedule pages and team game logs. These box scores have also allowed us to calculate a limited number of team splits.
Perhaps most significantly, we now have game logs and splits from the ABA days of some of the greatest players in basketball history, like Julius Erving and Rick Barry.
This data has also allowed us to create series stats pages for ABA Playoff series. Like this one, in which Dr. J averaged 37.7 PPG in an ABA Finals series win over David Thompson's Denver Nuggets.
This data has not yet been incorporated into player game finder searches or other play index tools, but that's something we'll be looking into in the future.
We hope everyone enjoys this new addition and thanks again to Michael Hamel for his permission to use this data and for his excellent research.
Posted in Announcement, Basketball-Reference.com, Data, History | Comments Off on ABA Box Scores & Splits Added
6th March 2015
We have had referee statistics back to 1988-89 on Basketball Reference for some time now. However, these stats are now more accessible than ever, as we have created a sortable table for each season back to 1989, allowing users to compare various statistics in games involving a particular referee.
Now you can discover which referees home teams love to see, which referees are friends to folks betting the over & and who tends to be involved in the games with the most whistles.
One important thing to remember with these statistics is that they represent all of the calls made in games each official works. Obviously, there are 3 officials working every game, so there is certainly noise in this data. Nonetheless, enough people are interested in these stats that we thought it was worth sharing as a launching point for users to draw their own conclusions or conduct further research.
Our referees section can be accessed by hovering over "more" on the far right of the bar towards the top of Basketball Reference. "Referees" is located between "NBL" & "Europe" on the menu that pops up when you hover over "more." It will lead you to this menu. From there, you can choose to view any referee's statistics, or to view all refs in a given season since 1989.
We hope everyone enjoys this new feature.
Posted in Announcement, Basketball-Reference.com, Data, Features | Comments Off on Year-By-Year Referee Register Added
3rd March 2015
One of the more common subjects for queries we receive at Sports-Reference is our SRS (Simple Rating System) figures. For some background, the first of our sites to add SRS was Pro-Football-Reference, when Doug Drinen added it to the site in 2006 and provided this excellent primer. The important thing to know is that SRS is a rating that takes into account average point differential and strength of schedule. For instance, the 2006-07 Spurs won games by an average of 8.43 points per game and played a schedule with opponents that were 0.08 points worse than average, giving them an SRS of 8.35. This means they were 8.35 points better than an average team. An average team would have an SRS of 0.0. The calculation can be complicated, but the premise is simple and it produces easily interpreted results.
However, there are some variations in the way we calculate SRS across our various sites. We'll break down these differences below.
Pro-Football-Reference.com SRS: PFR's SRS is unique in that a home-field advantage is included as a part of the calculation because of the short schedule compared to the other sports (we don't want a team to look relatively weak at the halfway point because they've only played 3 of their first 8 at home, for instance). This HFA fluctuates yearly based on game results, but it is generally somewhere between 2 and 3 points (2006 being an outlier, as you'll see). Below is a look at the HFA numbers we have used since 2001. If you'd like to calculate these HFAs yourself, just sum up every team's home point differential and then divide by the total number of games played across the league that season. This data can easily be found in the Play Index for each season:
- 2001: 2.0081
- 2002: 2.2461
- 2003: 3.5547
- 2004: 2.5078
- 2005: 3.6484
- 2006: 0.8477
- 2007: 2.8672
- 2008: 2.5586
- 2009: 2.2070
- 2010: 1.8945
- 2011: 3.2656
- 2012: 2.4336
- 2013: 3.1055
- 2014: 2.4883
College Football SRS: Our CFB SRS does not contain a home-field advantage element, but it does have some other quirks. Most importantly, we have capped the margin of victory considered for the formula. Due to the number of mismatches seen in college football, the maximum point differential a team can be credited with in a game is 24. We also credit all wins as a minimum of plus-7 margin of victory (so if you win by 1 point, it's treated the same as a 7-point win). The same logic is applied to losses, as well. One other wrinkle for CFB is that all non-major opponents are included as one team for the sake of the ratings.
College Basketball SRS: SRS for college hoops is straight forward (no HFA & no adjusted MOV), but one item to note is that games against non-major opponents are not counted in our calculations.
MLB, NBA & NHL: All of these SRS calculations are straight forward with no adjustments for HFA and no capping of MOV. It should be noted, however, that no special consideration is given for extra-innings, overtimes or shootouts, either.
We'll close with a quick rundown of the various merits and weaknesses of SRS, from Drinen's original 2006 post. These bullet points were created to describe the system used for NFL SRS, but many of the strengths and weaknesses can applied to the other sports, as well:
- The numbers it spits out are easy to interpret - if Team A's rating is 3 bigger than Team B's, this means that the system thinks Team A is 3 points better than Team B. With most ranking algorithms, the numbers that come out have no real meaning that can be translated into an English sentence. With this system, the units are easy to understand.
- It is a predictive system rather than a retrodictive system - this is a very important distinction. You can use these ratings to answer the question: which team is stronger? I.e. which team is more likely to win a game tomorrow? Or you can use them to answer the question: which of these teams accomplished more in the past? Some systems answer the first questions more accurately; they are called predictive systems. Others answer the latter question more accurately; they are called retrodictive systems. As it turns out, this is a pretty good predictive system. For the reasons described below, it is not a good retrodictive system.
- It weights all games equally - every football fan knows that the Colts' week 17 game against Arizona was a meaningless exhibition, but the algorithm gives it the same weight as all the rest of the games.
- It weights all points equally, and therefore ignores wins and losses - take a look at the Colts season. If you take away 10 points in week 3 and give them back 10 points in week 4, you've just changed their record, but you haven't changed their rating at all. If you take away 10 points in week 3 and give back 20 points in week 4, you have made their record worse but their rating better. Most football fans put a high premium on the few points that move you from a 3-point loss to a 3-point win and almost no weight on the many points that move you from a 20-point win to a 50-point win.
- It is easily impressed by blowout victories - this system thinks a 50-point win and a 10-point loss is preferable to two 14-point wins. Most fans would disagree with that assessment.
- It is slightly biased toward offensive-minded teams - because it considers point margins instead of point ratios, it treats a 50-30 win as more impressive than a 17-0 win. Again, this is an assessment that most fans would disagree with.
- This should go without saying, but - I'll say it anyway. The system does not take into account injuries, weather conditions, yardage gained, the importance of the game, whether it was a Monday Night game or not, whether the quarterback's grandmother was sick, or anything else besides points scored and points allowed.
Posted in Announcement, Baseball-Reference.com, Basketball-Reference.com, CBB at Sports Reference, CFB at Sports Reference, Data, FAQ, Features, Hockey-Reference.com, Pro-Football-Reference.com, SRS, Stat Questions, Statgeekery, Uncategorized | 2 Comments »
27th February 2015
Posted in Announcement, Baseball-Reference.com, Basketball-Reference.com, CBB at Sports Reference, CFB at Sports Reference, expire21d, Hockey-Reference.com, Olympics at S-R, Pro-Football-Reference.com, Statgeekery | Comments Off on Hiring: Analytics Consultant, Posted Feb 27, 2015
11th February 2015
Just a note that we have added Box Plus/Minus (BPM) to our College Basketball site this week.
As outlined in its introduction to Basketball Reference, BPM is an advanced stat intended to measure a player's total contribution as reflected by advanced, context-dependent box-score metrics like USG% and AST%. It was developed for the NBA using regression techniques against a 14-year-long sample of historical Regularized Adjusted Plus-Minus (RAPM) data. BPM estimates the number of points contributed by a player greater or less than an average player, per 100 team possessions.
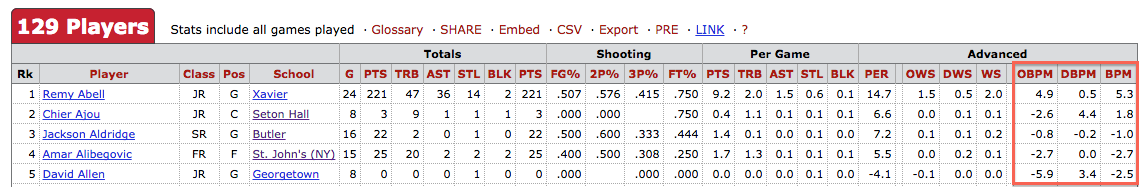
We're able to calculate BPM for seasons dating back to 2010-11 and it can be found initially on player pages in the 'Advanced' table, on our school season pages, also in the 'Advanced' table, and we've also added several advanced stats - including PER, Win Shares, and BPM - to the conference registers, along the right side of that page. (see below image). However, the best way to view BPM, as a sorted leaderboard, or according to any other criteria - is to use our Play Index search tools.
Again, our thanks to the creator of BPM, Daniel Myers, and to those whose work serves as a component. The methodology and logic of Box Plus/Minus (BPM) is discussed in our About section, and please note the section specifically for the NCAA.
(Note that the 'Advanced' tables on the player and schools pages have changed just a little, to accommodate the new stats. Individual ORtg and DRtg have been moved to the 'Per 100 Possessions' tables and Points Produced - the main component of ORtg - has been moved further to the left on the 'Advanced' table.)
* We have published BPM but not VORP for college basketball, unlike the NBA. Value over Replacement Player (VORP) owes its meaning and derivation to a market with salaried players and teams on an equal footing, and thus an easy-to-establish theoretical "replacement level", which doesn't exist or make sense for the NCAA.
Posted in Advanced Stats, Announcement, Basketball-Reference.com, CBB at Sports Reference | Comments Off on Adding Box Plus/Minus (BPM) to College Basketball
9th February 2015
Adam Wodon has joined Sports Reference today as a Managing Director for Hockey Reference. Adam will be working out of our Philadelphia office as our staff size has now risen to six. Adam brings a great deal of development experience and hockey knowledge to Sports Reference. Adam is the founder and managing editor of College Hockey News. Adam is an Isles fan through and through and also supports the Mets, Jets, and Nets making him the first diehard National League fan on staff. Adam is also on twitter at (@chn_AdamWodon).
Hans VanSlooten (@CantPitch) who had been working on the hockey site for the last 14 months will be taking over primary day-to-day development of Baseball-Reference.com.
Posted in Announcement, Baseball-Reference.com, Basketball-Reference.com, CBB at Sports Reference, CFB at Sports Reference, Expire30d, Hockey-Reference.com, Olympics at S-R, Pro-Football-Reference.com | 2 Comments »
9th February 2015
Playoff Box Plus/Minus (BPM)
We're now able to calculate Box Plus/Minus (BPM) and Value Over Replacement Player (VORP) for the playoffs, by extending the methodology used for the regular season, and calculating a team efficiency rating based on performance in the playoffs, adjusted for strength of playoff lineups (by using playoffs minute distributions and regular season BPM ratings). These ratings are interesting in themselves, and reflect some of the great playoffs runs - the 1996 Bulls' rating was +19.3, and the 2001 Lakers were +20.1.
The BPM figures themselves reflect the best individual playoff performances. LeBron's 2009 BPM of 18.2 is tops by a large margin, followed by Kareem's 1977 run and then the Jordan playoffs from 1989-1991.
(For a detailed explanation and further discussion see the "Playoff Box Plus/Minus and VORP" section of the write-up.)
Playoff VORP (and Pro-Rating the Regular Season)
As well as BPM, we can now calculate VORP for the playoff season. (If you need a refresher on VORP as a concept, please visit the original write-up when we introduced it to Basketball Reference). We calculate VORP for the playoffs similarly to the regular season - that is, [BPM - (-2.0)] * (% of minutes played) - and it should be interpreted identically. Again, that's as the number of points the player has produced over a replacement player, per 100 team possessions. The significance of VORP compared to BPM is that it's accumulative, rather than a rate stat, and thus accounts more literally for value provided, weighted as it is by minutes played, and expressed on a per-82 game basis*.
(* - Yes, this is new. We are now pro-rating VORP based on the number of games that a team has played during the regular season, and doing the same for the playoffs. One point of VORP is one point of full season team efficiency differential. This affects partial seasons, strike-shortened seasons, and the playoffs. This has significance for the playoffs, in particular - players on teams that go further or play in 7-game series will accumulate more because they have more opportunities.)
Some Minor Changes to the Equation
Please note that we've also updated the methodology, such that some players will have a slight variation in the BPM and associated stats. These were technical fixes to the regression methodology, which had the result of slightly changing the relative value of component stats. For example, blocks and shooting efficiency are two factors that are more highly favored by the revision and thus Anthony Davis saw the largest increase in BPM (+0.8), however most changes were of a much smaller magnitude. Please see the details of this revision in the write-up, under the "Updates" section.
Again, Basketball Reference extends its thanks to Daniel Myers, whose research the above represents. Also, please see the revised 'About BPM' write-up that details the methodology and is generally extremely useful for understanding the context of BPM and VORP, and the best ways to think about and use these stats.
Posted in Advanced Stats, Announcement, Basketball-Reference.com, CBB at Sports Reference, Playoffs | 2 Comments »


We're Social...for Statheads
Every Sports Reference Social Media Account
Site Last Updated: Friday, May 1, 2:56PM
Question, Comment, Feedback, or Correction?
Subscribe to our Free Email Newsletter
Do you have a sports website? Or write about sports? We have tools and resources that can help you use sports data. Find out more.