Sports Reference Blog
Super Bowl 50 Preview!
Posted by Jonah Gardner on February 5, 2016
In case you haven't heard, there is a football game this Sunday. Will this year's be another classic Super Bowl? A blowout? Let's dig into the numbers and see how the Broncos and Panthers look going into this game.
One thing to note about this year's Super Bowl is that SRS, our method of measuring team strength, didn't really think either team would make it this far. The Panthers ranked 6th in the NFL this year and 3rd in the NFC, behind the 2 teams they faced in the playoffs. Denver was 9th, with SRS putting them on par with Minnesota. Interestingly, this is the first Super Bowl matchup without a team that finished in the Top 5 in SRS. Of course, a high SRS ranking isn't necessarily a guarantee of a better game. The last time the #1 team played the #2 team, it was Seattle vs Denver in 2013. Denver's lowish ranking isn't particularly historic either; the Giants were 11th and 13th in 2007 and 2011, and the Cardinals were 21st in 2008.
That said, both teams did come out well in SRS on one side of the ball or the other. In terms of defensive SRS, the Broncos were 3rd, behind only Seattle and Cincy. Perhaps more surprisingly, given that they were only 13th in yards per play, the Panthers were 2nd in offensive SRS.
Denver doesn't look like any Peyton Manning team you've seen in a Super Bowl before, and certainly not the Broncos team that was just here two years ago. That team had an eye-popping 14.1 offensive SRS and a negative defensive one. This year's Broncos also averaged 5.39 yards per play, the lowest total by a Peyton Manning led attack since 2002 (for simplicity's sake, I included the games that Osweiler started).
So what did Denver need from Manning when he started? To protect the ball. If you've missed the gunslinger/game manager debate, Peyton Manning's 2015 record lets us party like it's 2009. In games where Manning threw 0 or 1 interception, the Broncos were 6-0:
| Passing | ||||||||||
|---|---|---|---|---|---|---|---|---|---|---|
| Date | Opp | Result | Cmp | Att | Yds | TD | Int | |||
| 2015-09-13 | BAL | W 19-13 | 24 | 40 | 60.00 | 175 | 0 | 1 | 59.9 | 4.38 |
| 2015-09-17 | KAN | W 31-24 | 26 | 45 | 57.78 | 256 | 3 | 1 | 86.9 | 5.69 |
| 2015-09-27 | DET | W 24-12 | 31 | 42 | 73.81 | 324 | 2 | 1 | 101.7 | 7.71 |
| 2015-11-01 | GNB | W 29-10 | 21 | 29 | 72.41 | 340 | 0 | 1 | 96.9 | 11.72 |
| 2016-01-17 | PIT | W 23-16 | 21 | 37 | 56.76 | 222 | 0 | 0 | 74.4 | 6.00 |
| 2016-01-24 | NWE | W 20-18 | 17 | 32 | 53.13 | 176 | 2 | 0 | 90.1 | 5.50 |
I left off the Week 17 game where he came in after halftime, but in that game, which Denver also won, he didn't throw a pick. In contrast, when Manning does get picked off 2 or more times, Denver is just 3-2:
| Passing | ||||||||||
|---|---|---|---|---|---|---|---|---|---|---|
| Date | Opp | Result | Cmp | Att | Yds | TD | Int | |||
| 2015-10-04 | MIN | W 23-20 | 17 | 27 | 62.96 | 213 | 1 | 2 | 68.9 | 7.89 |
| 2015-10-11 | OAK | W 16-10 | 22 | 35 | 62.86 | 266 | 0 | 2 | 62.3 | 7.60 |
| 2015-10-18 | CLE | W 26-23 | 26 | 48 | 54.17 | 290 | 1 | 3 | 53.3 | 6.04 |
| 2015-11-08 | IND | L 24-27 | 21 | 36 | 58.33 | 281 | 2 | 2 | 78.6 | 7.81 |
| 2015-11-15 | KAN | L 13-29 | 5 | 20 | 25.00 | 35 | 0 | 4 | 0.0 | 1.75 |
Manning keeping his interceptions down will be a vital for Denver's gameplan, but that 3-2 record even with multiple INTs shows that who's in charge here. This Denver team is strong enough defensively to withstand a bad day from Manning...as long as they can control the short pass. If we define short passes as throws under 15 yards, then in Denver wins, opposing QBs have averaged just 5.5 yards per attempt on short passes. They've also put up 0.7 TDs per game vs 0.7 INTs when they throw short, for a passer rating of 77.3.
Compare that to the line opposing QBs put up on short passes when they win: 6.3 yards per attempt, 1.5 TDs per game, 0.3 INTs per game, and a 96.0 passer rating. Those numbers match or come close what the league averages on short passes. For Denver to succeed, they need their defense to take away short routes.
Can they do that to Cam? His 101.8 passer rating on short throws was 6th this year. However, the guy who finished one spot above him just had a day where he went 23-45 and had a passer rating of 61.7 on short throws.
Denver also needs to suppress scoring in general. When Broncos games went under the Vegas Over/Under, Denver was 9-1. That's the best record on unders of any team this year:
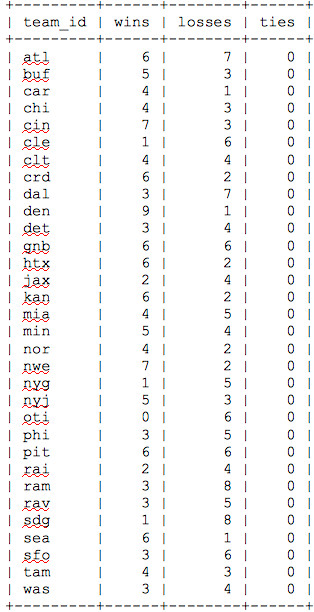
Record on Unders in 2015
On the other hand, they were 5-3 when the score went over or pushed, similar to how the Jets did:
Comparing the Broncos' performance to a team with Ryan Fitzpatrick at QB brings us back to the elephant in the room: Peyton Manning. According to Adjusted Net Yards per Attempt, which adjusts raw y/a to allow for INTs, TDs, and sacks, Manning was the worst qualified QB in the NFL this year.
However, the problem is most pronounced on 3rd down. Now, QBs in general do worse on 3rd down; for example, here's how they did in 2015:
| Passing | |||||||||
|---|---|---|---|---|---|---|---|---|---|
| Down | Cmp | Att | Yds | TD | Int | ||||
| 1st | 4640 | 7213 | 64.3 | 51135 | 7.1 | 267 | 157 | 88.5 | 6.5 |
| 2nd | 4105 | 6349 | 64.7 | 43187 | 6.8 | 314 | 129 | 92.3 | 6.5 |
| 3rd | 3051 | 5153 | 59.2 | 33127 | 6.4 | 258 | 152 | 82.6 | 5.6 |
| 4th | 178 | 334 | 53.3 | 1916 | 5.7 | 28 | 19 | 74.6 | 4.6 |
This is true of Manning, who has a career passer rating of 88.0 on 3rd down, vs 96.0 in all situations. But this year he was worse. Much worse:
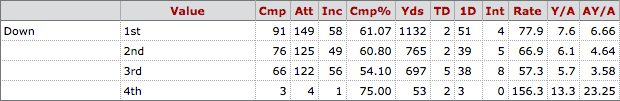
To put that in perspective, the last QB to have a passer rating of 57.3 in a season (setting the minimum at 120 pass attempts) was Josh Freeman in 2013. Other people who appear on that list: Ryan Leaf, JaMarcus Russell. If you prefer AY/A, Manning's performance on 3rd downs is 2010 Matt Moore-esque.
You don't need me to tell you that this isn't good, but you may need me to tell you that this is especially not good against Carolina. The Panthers faced the 6th most passes on 3rd down this year. They gave up 1st downs on 38.8% of them, a not particularly impressive number that ranks in the top half of the league. But that was against QBs who were not Peyton Manning and, therefore, almost certainly had a better passer rating on 3rd down. If Manning is stuck in passing situations on 3rd down, Denver's offense is probably sunk.
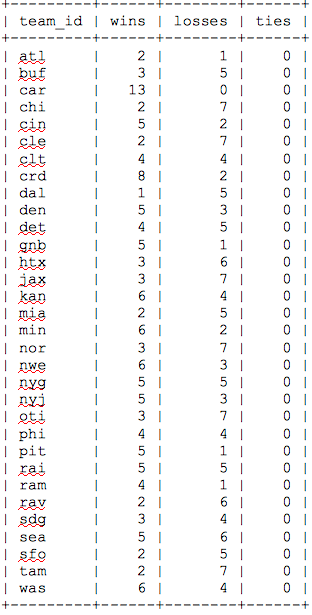
From Carolina's perspective, the key battle may involve turnovers. All teams do better when they win the turnover battle but Carolina A.) won the turnover battle a lot and B.) did very, very well when they did. Here's how many games each team had where their turnover margin was +1 or better and how they fared when that happened (including the playoffs):
Carolina is the 22nd team since the merger to post a turnover margin of +1 or better in 13 games or more and only 7 other teams on that list went undefeated every time they won the turnover battle. But the Broncos were also undefeated when they won the turnover battle, going 8-0.
The Broncos have also had the best rushing defense in the NFL this year. They're going to need it. Counting the playoffs, the Panthers had a rushing yard margin (in other words, rushing yards for minus rushing yards allowed) of 1,025, the most in the league and one of the 15 best since 2006. If Denver does take away the short passing game, Carolina will need to dominate the ground to win.
Another key for the Panthers this season: their excellent starting field position. The Chiefs were the only team with better starting field position than the Panthers, whose average starting spot was a little past their 30 yard line. When they started at their own 30 or better, Carolina scored 65% of the time.
Interestingly, this may be a problem that Denver is equipped to handle. Their average defensive drive started on their opponent's 29.5, the 3rd worst average starting field position for a defense in the NFL. Despite spotting teams more yards than almost any other defense, they still only allowed scores on 28% of drives.
That makes sense, given that the Broncos featured an elite defense supporting an average-at-best offense. In the end, the story of the game may come down to this. Here's the NFL's leading offenses in points per drive:
| Average Drive | ||
|---|---|---|
| Rk | Tm | Pts ? |
| 1 | Carolina Panthers | 2.40 |
| 2 | Arizona Cardinals | 2.37 |
| 3 | New England Patriots | 2.34 |
| 4 | Seattle Seahawks | 2.27 |
| 5 | Cincinnati Bengals | 2.26 |
| 6 | New Orleans Saints | 2.14 |
| 7 | Pittsburgh Steelers | 2.10 |
| 8 | New York Giants | 2.03 |
| 9 | Kansas City Chiefs | 1.99 |
| 10 | Buffalo Bills | 1.95 |
| 11 | Washington Redskins | 1.95 |
| 12 | New York Jets | 1.95 |
| 13 | Detroit Lions | 1.93 |
| 14 | Minnesota Vikings | 1.90 |
| 15 | Chicago Bears | 1.88 |
| 16 | Tampa Bay Buccaneers | 1.85 |
| 17 | Jacksonville Jaguars | 1.85 |
| 18 | Atlanta Falcons | 1.84 |
| 19 | Green Bay Packers | 1.83 |
| 20 | Oakland Raiders | 1.79 |
| 21 | San Diego Chargers | 1.78 |
| 22 | Philadelphia Eagles | 1.62 |
| 23 | Baltimore Ravens | 1.62 |
| 24 | Denver Broncos | 1.58 |
| 25 | Houston Texans | 1.57 |
| 26 | Indianapolis Colts | 1.54 |
| 27 | Miami Dolphins | 1.52 |
| 28 | Dallas Cowboys | 1.50 |
| 29 | Tennessee Titans | 1.50 |
| 30 | Cleveland Browns | 1.46 |
| 31 | St. Louis Rams | 1.29 |
| 32 | San Francisco 49ers | 1.28 |
| League Total | 1.84 | |
And here are the leading defenses:
| Average Drive | ||
|---|---|---|
| Rk | Tm | Pts ? |
| 1 | Denver Broncos | 1.38 |
| 2 | Seattle Seahawks | 1.43 |
| 3 | Cincinnati Bengals | 1.44 |
| 4 | New York Jets | 1.45 |
| 5 | Carolina Panthers | 1.45 |
| 6 | Houston Texans | 1.51 |
| 7 | St. Louis Rams | 1.52 |
| 8 | Kansas City Chiefs | 1.52 |
| 9 | New England Patriots | 1.54 |
| 10 | Arizona Cardinals | 1.66 |
| 11 | Green Bay Packers | 1.66 |
| 12 | Minnesota Vikings | 1.70 |
| 13 | Pittsburgh Steelers | 1.71 |
| 14 | Buffalo Bills | 1.81 |
| 15 | Dallas Cowboys | 1.89 |
| 16 | Oakland Raiders | 1.92 |
| 17 | Miami Dolphins | 1.94 |
| 18 | Atlanta Falcons | 1.94 |
| 19 | Washington Redskins | 1.97 |
| 20 | Baltimore Ravens | 1.98 |
| 21 | Indianapolis Colts | 1.98 |
| 22 | Philadelphia Eagles | 1.99 |
| 23 | San Diego Chargers | 2.00 |
| 24 | Chicago Bears | 2.01 |
| 25 | San Francisco 49ers | 2.04 |
| 26 | Jacksonville Jaguars | 2.05 |
| 27 | Tennessee Titans | 2.06 |
| 28 | Detroit Lions | 2.13 |
| 29 | New York Giants | 2.18 |
| 30 | Tampa Bay Buccaneers | 2.23 |
| 31 | Cleveland Browns | 2.26 |
| 32 | New Orleans Saints | 2.58 |
| League Total | 1.84 | |
Do you see the problem for the Broncos? While Carolina makes the top 5 on both lists, the Broncos are 24th in points per drive. The only reason they rank higher than that in points for is that Denver is 4th in number of drives, but the faster they play the more drives they'll create for Carolina's elite scoring offense.
To bring this full circle, SRS has the Panthers as 2.3 point favorites to win this game, below the Vegas line of 5.5. In other words, we could be in for a much closer game than people are expecting. Still, on paper, Carolina's well-rounded construction seems to give them an advantage over Denver's unbalanced team.
Lastly, a few historic notes:
-If the Broncos win, their Super Bowl record will improve to 3-5, meaning either way, they would no longer be the team with the worst Super Bowl record among the ones who have won at least 1.
-Carolina, on the other hand, would become the 20th team to win a Super Bowl. They would also be the most recently formed team to win a Super Bowl (unless you decide to count the Ravens, like this table does since that team's Cleveland history belongs to the Browns franchise).
-Cam Newton would be the 15th QB to win a Super Bowl in his first five seasons
-Peyton Manning, on the other hand, would be the oldest QB to win a Super Bowl. The current record holder is John Elway, who was 38, a full year younger than Manning, when he won Super Bowl XXXIII.
-Ron Rivera would be the 3rd person to win a Super Bowl as a player and a coach. The other two were Rivera's HC for his Super Bowl win, Mike Ditka, and Manning's, Tony Dungy.
-That note needs a subnote, which is that Tom Flores was on the Chiefs team that won Super Bowl IV, but didn't play in the game
-Riverboat Ron would also be the 3rd coach to lost a Super Bowl as Offensive or Defensive Coordinator and win as Head Coach, after Sean Payton and Mike Shanahan. The QB who beat DC Rivera? Peyton Manning
-Most of the career Super Bowl records are out of Manning's reach, but he does have an outside shot at passing Troy Aikman for the best career Super Bowl completion percentage. If things go really south, he could also make a run at John Elway's record for the most INTs in a Super Bowl.
Before the game, don't forget to check out our infographic about gambling on the Super Bowl and popular bets. We also made a list of the 14 Biggest Plays in Super Bowl History, as judged by our win probability model. And if you don't follow Pro-Football-Reference on Twitter, where it's @pfref, you definitely should before Sunday. We'll be on all evening, giving live updates on the game, answering your questions about stats and Super Bowl History, and cracking wise about the commercials.
We're Social...for Statheads
Every Sports Reference Social Media Account
Site Last Updated: Friday, May 1, 2:56PM
Question, Comment, Feedback, or Correction?
Subscribe to our Free Email Newsletter
Do you have a sports website? Or write about sports? We have tools and resources that can help you use sports data. Find out more.