12th September 2018
This season, the Boston Red Sox have been on quite a tear, with a .683 winning percentage after their September 11th win over Toronto. Now you can compare them with other teams through September 11 using our new Records Through Calendar Day tool in the Play Index. Since 1969 (the beginning of the Divisional Era), the 2018 Red Sox have the fifth-best winning percentage of any team through September 11. Here's a look at the top 10:
Another storyline earlier in the season was how impressive the Angels' 12 wins and the Mets' 11 wins through April 13 were. Of course, since then those two teams have fallen out of the playoff race, but searching for the other teams in recent memory that have racked up wins early in the calendar show that April success is very hit or miss in informing rest-of-season performance. Here's a look at teams in past seasons with double-digit wins through April 13:
If you have any questions or suggestions, feel free to contact us through our feedback form.
Posted in Announcement, Baseball-Reference.com, Features, Play Index | Comments Off on Baseball Records Through A Calendar Day
29th August 2018
Baseball-Reference is happy to introduce a new Today's Batter vs. Pitcher Matchups page, which will display the top hitting matchups to look out for with the day's projected starting pitchers. You can find this right now by looking at the bottom of the Previews section on Baseball-Reference's front page.
Our default sorting uses an internal weighting so that favorable hitting matchups with a larger sample size rise to the top, such as today's top matchup of Victor Martinez with a .400/.460/.644 line against Danny Duffy over 50 plate appearances, or a dominant .438/.550/1.063 line by Matt Carpenter versus Trevor Williams in just 20 plate appearances. However, if you're interested in raw numbers, like most home runs or lowest OPS and the like, all of the columns are sortable. We also have links to each matchup's individual plate appearances if you want to dive into more specifics, perhaps taking a look at just the most recent games a pitcher and batter have faced off.
This feature was added thanks to a suggestion made during the making of our Stathead newsletter, which is in its first week of release. You can subscribe to our newsletter here. If you have any questions or suggestions, feel free to contact us through our feedback form.
Posted in Announcement, Baseball-Reference.com, Features | Comments Off on Daily Batter vs. Pitcher Matchups to Watch: Now on Baseball-Reference
22nd August 2018
Basketball-Reference already had a section for single-game league records for various categories, such as points and total rebounds. But now, we've made it easier to see an individual player's single-game records by adding a Game Highs table to every player page. It will be located below the Advanced table (as well as the Shooting and Play-By-Play tables for post-2000 players).
For example, this is what Kevin Durant's Game Highs table looks like:
Game Highs Table
|
Game Highs |
| Season |
Age |
Tm |
Lg |
MP |
FG |
FGA |
3P |
3PA |
2P |
2PA |
FT |
FTA |
ORB |
DRB |
TRB |
AST |
STL |
BLK |
TOV |
PF |
PTS |
| 2007-08 |
19 |
SEA |
NBA |
51:14 |
18 |
26 |
4 |
9 |
17 |
23 |
15 |
16 |
3 |
10 |
13 |
9 |
4 |
5 |
8 |
4 |
42 |
| 2008-09 |
20 |
OKC |
NBA |
50:22 |
16 |
27 |
6 |
10 |
13 |
24 |
24 |
26 |
4 |
13 |
15 |
7 |
5 |
4 |
7 |
5 |
47 |
| 2009-10 |
21 |
OKC |
NBA |
47:17 |
16 |
31 |
7 |
13 |
15 |
29 |
18 |
18 |
4 |
13 |
14 |
8 |
5 |
4 |
8 |
6 |
45 |
| 2010-11 |
22 |
OKC |
NBA |
52:28 |
15 |
28 |
5 |
13 |
13 |
22 |
16 |
19 |
4 |
16 |
18 |
6 |
4 |
5 |
7 |
6 |
47 |
| 2011-12 |
23 |
OKC |
NBA |
52:24 |
19 |
34 |
5 |
10 |
14 |
25 |
15 |
17 |
3 |
15 |
17 |
8 |
4 |
4 |
9 |
5 |
51 |
| 2012-13 |
24 |
OKC |
NBA |
49:40 |
16 |
31 |
5 |
11 |
13 |
25 |
21 |
21 |
3 |
15 |
17 |
11 |
5 |
4 |
8 |
6 |
52 |
| 2013-14 |
25 |
OKC |
NBA |
52:29 |
19 |
34 |
7 |
15 |
15 |
25 |
22 |
24 |
3 |
13 |
14 |
12 |
4 |
4 |
11 |
5 |
54 |
| 2014-15 |
26 |
OKC |
NBA |
44:30 |
14 |
26 |
7 |
12 |
12 |
21 |
12 |
12 |
3 |
10 |
11 |
9 |
4 |
3 |
6 |
3 |
44 |
| 2015-16 |
27 |
OKC |
NBA |
53:32 |
15 |
30 |
7 |
12 |
12 |
23 |
16 |
18 |
4 |
13 |
17 |
10 |
4 |
5 |
10 |
6 |
44 |
| 2016-17 |
28 |
GSW |
NBA |
49:08 |
15 |
28 |
7 |
11 |
12 |
19 |
15 |
18 |
3 |
17 |
17 |
10 |
4 |
6 |
7 |
5 |
40 |
| 2017-18 |
29 |
GSW |
NBA |
42:19 |
17 |
32 |
6 |
14 |
12 |
20 |
14 |
15 |
3 |
11 |
13 |
14 |
3 |
7 |
8 |
5 |
50 |
| Career |
|
|
|
53:32 |
19 |
34 |
7 |
15 |
17 |
29 |
24 |
26 |
4 |
17 |
18 |
14 |
5 |
7 |
11 |
6 |
54 |
| 9 Seasons |
|
OKC,SEA |
NBA |
53:32 |
19 |
34 |
7 |
15 |
17 |
29 |
24 |
26 |
4 |
16 |
18 |
12 |
5 |
5 |
11 |
6 |
54 |
| 2 Seasons |
|
GSW |
NBA |
49:08 |
17 |
32 |
7 |
14 |
12 |
20 |
15 |
18 |
3 |
17 |
17 |
14 |
4 |
7 |
8 |
5 |
50 |
You can see Durant's career high in 3-pointers made in a game is seven, which he's tied in five different seasons. Also, looking at the 2017-18 season, it's easier to see that he achieved a new personal high for blocks in a game.
For players with postseason statistics, there will also be a Playoff Game Highs table further down a player's page, just above the Similarity Scores table. If you have any questions or suggestions, feel free to contact us through our feedback form.
Posted in Announcement, Basketball-Reference.com, Features | Comments Off on Basketball-Reference Adds Single-Game Highs Tables
10th August 2018
Regular Basketball-Reference users are well acquainted with the Play Index, which allows us to compare players across eras and slice and dice season-level data by many criteria. Today we are now introducing the WNBA Player Season Finder, which will be accessible from both the Play Index page and from our WNBA home page. We have WNBA stats back to the league's inaugural 1997 season, which means you can now search all of WNBA history with this tool.
Just like our NBA Player Season Finder, with the new WNBA tool you can do single-season, combined season and total season searches. For example, with the combined season search, you can now create franchise career leaderboards, maybe to see how far ahead in first place Tamika Catchings is among point scorers in Indiana Fever history. Or with the total seasons search, you can now execute a search like players with the most qualified seasons of 2 blocks per game; Margo Dydek and Lisa Leslie lead with nine seasons each finishing with that mark in their career.
Of course, current season stats are also searchable with the Player Season Finder, so you can give them some perspective with past stats. A'ja Wilson is burning up the league in her first WNBA season, currently averaging over 20 points per game. Here's a look at the others in WNBA history who finished with 20 points per game in their rookie season.
Query Results Table
|
|
|
|
|
|
Tota |
Tota |
Per |
Per |
Per |
Per |
Per |
Per |
Per |
Per |
Per |
Shoo |
Shoo |
Shoo |
Shoo |
Shoo |
| Rk |
Player |
Season |
Tm |
Lg |
PTS |
G |
GS |
MP |
FG |
FGA |
2P |
2PA |
3P |
3PA |
FT |
FTA |
FG% |
FT% |
2P% |
3P% |
eFG% |
| 1 |
Cynthia Cooper |
1997 |
HOU |
WNBA |
22.2 |
28 |
28 |
35.1 |
6.8 |
14.5 |
4.4 |
8.7 |
2.4 |
5.8 |
6.1 |
7.1 |
.470 |
.864 |
.508 |
.414 |
.553 |
| 2 |
Seimone Augustus |
2006 |
MIN |
WNBA |
21.9 |
34 |
34 |
33.1 |
8.3 |
18.2 |
7.4 |
15.7 |
0.9 |
2.5 |
4.4 |
4.9 |
.456 |
.897 |
.473 |
.353 |
.481 |
| 3 |
A'ja Wilson |
2018 |
LVA |
WNBA |
20.3 |
29 |
29 |
30.8 |
7.1 |
16.0 |
7.1 |
16.0 |
0.0 |
0.0 |
6.0 |
7.7 |
.446 |
.785 |
.446 |
|
.446 |
Stay tuned for more additions to the WNBA section of our site here on the Sports-Reference Blog. If you have any questions or suggestions, feel free to contact us through our feedback form.
Posted in Advanced Stats, Announcement, Basketball-Reference.com, Features, History, Leaders, Play Index, Stat Questions, Statgeekery | 4 Comments »
9th August 2018
In an inevitability, your team gets off to a rocky start by dropping its first four games of the season. NFL media members will then leap to giving you some morsel of hope by telling you, "Wait, this 0-4 team made the playoffs, so don't panic!"
Well, now you can find this kind of information on your own with Pro-Football-Reference's Team Record Finder, the latest addition to our ever-expanding Play Index. With this tool, you can input any record that a team may have had at some point in their season, and then see the final record of every team that was in that situation.
Using the previously mentioned example, here is a list of the 91 teams since 1990 (when the 12-team playoff system began) that started 0-4 and their final records. Along with a full list, the Team Record Finder gives you a nice summary including a team's average finish (4-12 if you started 0-4) and the percentage of teams who made the playoffs (1.1% of 0-4 teams managed to accomplish that). For teams that did make the playoffs, we also include how far they got; we can see that the only 0-4 team to make the playoffs was the 1992 San Diego Chargers, who finished the regular season with 11 wins and won their wild card game before falling in the divisional round to the Miami Dolphins.
If you have any questions or suggestions, feel free to contact us through our feedback form.
Posted in Announcement, Data, Features, History, Play Index, Pro-Football-Reference.com | 4 Comments »
9th July 2018
On Baseball-Reference and Basketball-Reference, we've offered an option to see game logs on a team basis. If you wanted to take a look at the averages of the Miami Heat's 27-game winning streak in 2013, or how the Cardinals did in 2016 when they hit multiple home runs in 9 consecutive games, summable game logs allow you to check the averages during your specified span (done by clicking on two rows to highlight the group of games you're interested in).
Now, we've gone ahead and made that an option for Hockey-Reference and Pro-Football-Reference as well. Want to add up the goal differential during the Columbus Blue Jackets' 16-game winning streak in December 2016? Or maybe take a look at how many yards the Browns gave up in just the second half of 2017? That can now be done with the addition of summable game logs to team pages. Similarly to team game logs on Baseball-Reference and Basketball-Reference, just click on two rows and the site will sum and average the rows highlighted in that range.
If you have any questions or suggestions, feel free to contact us through our feedback form.
Posted in Announcement, Features, Hockey-Reference.com, Pro-Football-Reference.com, Tips and Tricks | 5 Comments »
18th June 2018
While the NBA is in offseason mode, teams are still making moves to improve themselves, and the same goes for Basketball-Reference as well. With that in mind, we've added a page that details historical data for seven-game playoff series based on various game results. Just to give an example, if we had just watched the Cavs go down 2-3 to the Celtics in the Eastern Conference Playoffs, you'd look for the Team is Down column, find the 2-3 section, and locate their predicament where they'd lost the first two away games, won their first two home games and then lost the third away game, displayed as two red A's, two green H's and one more red A. Then, you'd find that prior to the Cavs pulling off the series win, teams in that situation were 2-40, with only the '07 Utah Jazz and the '08 San Antonio Spurs able to pull off the same feat. We have overall winning records for both the modern 2-2-1-1-1 format, as well as the classic 2-3-2 format.
If you have any questions or suggestions, feel free to contact us through our feedback form.
Posted in Announcement, Basketball-Reference.com, Data, Features, History, Playoffs | Comments Off on Basketball-Reference Adds Historical Playoff Series Outcome Data
15th June 2018
The 2017-18 NBA season may have ended rather predictably, but that doesn't mean the NBA offseason isn't just as filled with important activity. So, to keep you updated on all the latest transactions, we've brought back our Free Agent Tracker for 2018. Perhaps LeBron James or Kevin Durant will throw everyone for a swerve? More realistically, if you want to keep an eye on the destination of guys like Paul George, Clint Capela and J.J. Redick, we'll be keeping track of their eventual destinations and disclosed contract information here.
If you have any questions or suggestions, feel free to contact us through our feedback form.
Posted in Announcement, Basketball-Reference.com, Features | Comments Off on 2018 NBA Free Agent Tracker is Live
5th June 2018
Posted in Announcement, Baseball-Reference.com, Basketball-Reference.com, Bleg, CBB at Sports Reference, CFB at Sports Reference, expire21d, FBref, Features, General, Hockey-Reference.com, Statgeekery | 1 Comment »
13th March 2018
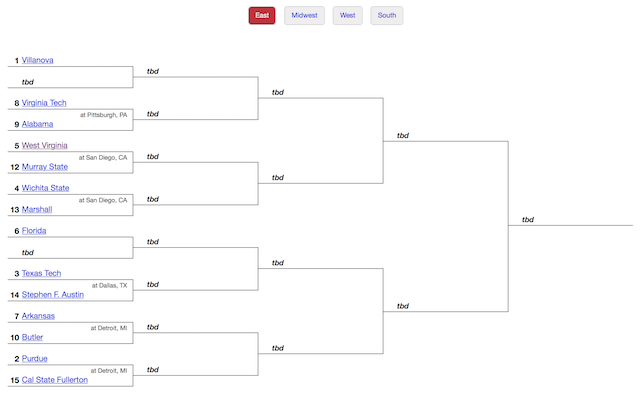
March Madness is upon us, beginning with the First Four tonight. To help college basketball fans and casuals get ready for the Big Dance, we at Sports-Reference have prepared a small guide of features available on our site for just such an occasion.
Of course, what is a college basketball site without some brackets to pore over? In addition to having all four regions available in bracket form, we have links to all of the participating schools. Maybe you're looking for Providence's strength of schedule? Or maybe you need to catch up on who else is playing with DeAndre Ayton at Arizona? That and a lot more can be found on every team's 2017-18 page, easily found on the bracket.
Other features include:
Our NCAA Tournament Forecast, which bases odds of teams reaching the Sweet 16 and beyond on 5,000 simulations. This forecast will keep updating as real-life tournament results come in.
We have records and box scores of every NCAA Tournament going back to 1939. So if you need a refresher on how North Carolina got to the championship game last year, or are feeling nostalgic for the days when Georgetown was actually in the tournament, we have it all.
The NCAA Tournament Matchup Finder is ready for your bracketology research purposes. Maybe you need some context on how often the 13 seed pulls off an upset in the first round? Perhaps you'd like to take a 7 seed making it to the Final Four in three out of the last four tournaments into account when filling out the bracket? All of that info is at your fingertips with the Matchup Finder.
Our NCAA Tournament Player Game Finder will come in handy when you want to compare this year's standout players to stars of years past. Maybe we'll need to know who else went off for 40 points in a first round game. Let's hope for fireworks.
We'll also be keeping track of All-Region Teams, All-Tournament Teams and the Most Outstanding Player; you can find those bestowed with these honors in previous tournaments on our site as well.
From LIU v. Radford tonight to the National Championship Game at the Alamodome on April 2, we'll be here keeping you updated on all the latest in tournament action!
Posted in Announcement, CBB at Sports Reference, Features | 2 Comments »
We're Social...for Statheads
Every Sports Reference Social Media Account
Site Last Updated: Friday, May 1, 2:56PM
Question, Comment, Feedback, or Correction?
Subscribe to our Free Email Newsletter
Do you have a sports website? Or write about sports? We have tools and resources that can help you use sports data. Find out more.