Sports Reference Blog

Archive for the 'Basketball-Reference.com' Category

Every Time an NBA Team Came Back From a 3-1 Deficit (and What It Means for the Warriors)

25th May 2016

It was just a couple of weeks ago that we were all admiring the Golden State Warriors' latest feat in a season full of them: keeping up their winning ways without the help of the NBA MVP. While Stephen Curry has returned, the winning has come to a sudden halt.

After spending Sunday and Tuesday night getting obliterated by the Oklahoma City Thunder, the Bay Area's most popular export since 99% Invisible is just one loss away from an early start to their summer. In their last six games, the Warriors went 3-3 with a point differential of -20. During their disastrous excursion to Oklahoma City, they were outscored by 52 points and out-rebounded by 30 boards.

The Warriors are on the brink of a very dark abyss, but they have some historical precedent to look to. There have been nine times in the history of the NBA Playoffs where a team was down 3-1 in a series and came back to win. Looking back at those examples, we can see if any patterns emerge that give the Warriors a roadmap for digging themselves out or show the Thunder what mistakes they need to avoid. Read the rest of this entry

Posted in Announcement, Basketball-Reference.com, Playoffs | 5 Comments »

2016 NBA Free Agent Tracker

24th May 2016

Unless you're a fan of a conference finalist, chances are you're beginning to look ahead to the offseason and what players your team can add via free agency in July and beyond. So go ahead and click this link for our 2016 NBA Free Agent Tracker and check out who might be available this offseason. The players are automatically sorted by their 2015-16 Win Shares totals, from Kevin Durant's 14.5 to Tony Wroten's -0.8.


Posted in Announcement, Basketball-Reference.com, Data, Uncategorized | Comments Off on 2016 NBA Free Agent Tracker

The 15 Biggest Playoff Upsets in NBA History

19th May 2016

The Oklahoma City Thunder shouldn't be here. It's weird to think of a team that won 55 games and boasts 2 of the 5 best players in the league (at least, according to the NBA MVP voting) as an underdog, but the Thunder spent the year in the same conference as two historically dominant teams. There was the San Antonio Spurs, who posted the 7th best point differential of all-time. At the same time, there was the Golden State Warriors who, in case you didn't hear, won a lot of games this season.

Yet the Thunder tore through the Spurs, winning the series in 6, clinching it in a blowout, and perhaps ending then nearly 20-year career of Tim Duncan. Then they followed it up by going to one of the toughest arenas for road teams in the NBA and stealing Game 1 from the 73-win defending champs. Read the rest of this entry

Posted in Basketball-Reference.com, Playoffs | Comments Off on The 15 Biggest Playoff Upsets in NBA History

How Are the Warriors Staying Afloat Without Stephen Curry?

5th May 2016

The Golden State Warriors' driverless UberX hit its first real speed bump of the season when Stephen Curry sprained his MCL halfway through Game 4 of the 2016 NBA Playoffs. Without the presumptive NBA MVP, the hyperdrive engine that powers one of the best offenses in NBA history, it was only natural to assume the Warriors would take a step back.

Of course, that's also assuming this Warriors team is mortal. Since the start of the 2nd half of Game 4, when they lost Curry to the knee injury, the Warriors have outscored their opponents by a total of 81 points. The team's eFG% of .542 is below its regular season mark of .563, but a number that still would have been the best in the NBA this year. Read the rest of this entry

Posted in Announcement, Basketball-Reference.com, Playoffs | Comments Off on How Are the Warriors Staying Afloat Without Stephen Curry?

Player Stats for 1993-94 College Basketball Season Added

29th April 2016

As we continue to work towards our goal of covering college basketball's shot-clock era (since 1985-86), we have recently added player stats for the 1993-94 college basketball season.

That was the season in which Arkansas rode its 40 Minutes of Hell style to a national championship and National Player of the Year Glenn Robinson averaged an incredible 30.3 PPG (an average that no one has bested since).

You can check out the player leaders for this season here. Additionally, similar player leaderboards can be found for each conference page for the season. Or you can check out tables that have the player stats for every player in a given conference that season.

This addition has also allowed us to extend our leaderboards back to 1993-94 for many categories, such as the yearly national PPG leader since 1993-94 or the most career assists since 1993-94.

If you preferring making your own, customized, leaderboards, you can do so back to 1993-94 in the Player Season Finder.

Here's a few sample searches:

One more thing to note: Since we only have full team stats back to 1995-96, at this time we are not yet able to calculate player win shares for seasons before 1995-96.

Posted in Announcement, Basketball-Reference.com, CBB at Sports Reference, Data, History | Comments Off on Player Stats for 1993-94 College Basketball Season Added

Who Was the Best Team of the 2000s?

14th April 2016

Everyone knows who the best team of the 1990s was. The 1995-96 Chicago Bulls had Michael Jordan, the greatest player of all-time, leading a cast that included two of the greatest defenders of all-time, a legendary sharpshooter, and a Hall of Fame coach. That team's 72-win regular season seemed like the modern equivalent of Joe DiMaggio's hit streak, a record so unfathomable that we all knew it would never be broken.

Except that this year, it was. The Golden State Warriors still have a title to win, but it's not too early to say that, if they are crowned NBA Finals' champs, they'll likely be remembered as the best team of the 2010s (at least, until the 2019 76ers, under Bryan Colangelo's leadership, win 74 games). Read the rest of this entry

Posted in Announcement, Basketball-Reference.com | 17 Comments »

2015-16 Warriors Enter NBA Record Book

14th April 2016

The 2015-16 Golden State Warriors have earned a seat at the table in the discussion of the greatest teams in NBA history. They've set a new standard with 73 regular-season wins. Let's examine some of their other accomplishments this season:

  • 6th-best SRS in NBA history: SRS stands for Simple Rating System and is a rating method that takes into account margin of victory and strength of schedule.
  • 6th-best average margin of victory in NBA history: The Warriors outscored their opponents by 10.76 PPG, which was the best by any NBA team since the 1996-97 Bulls outscored their opposition by 10.80 PPG. However, the Warriors outscored their opponents by 10.0 PPG in the 1st three quarters of games alone, which is something none of the teams ahead of them on the list managed.
  • Most road wins in NBA history: The Dubs went 34-7 on the road, surpassing the 33 road wins by the 1995-96 Bulls.
  • 2nd-longest winning streak in NBA history: After winning their final four regular-season games in 2014-15, the Warriors ran off 24 straight wins to start 2015-16, coming up five games short of matching the 1971-72 Lakers' 33-game winning streak.
  • Longest home winning streak in NBA history: The Warriors' 54-game home winning streak was enough to surpass the old record (44) by the mid-90s Bulls.
  • 3rd-longest road winning streak in NBA history: Their 14-game road winning streak was good enough for a tie for the 3rd-longest in NBA history (just two games shy of the record).
  • Best Effective FG% in NBA history: When accounting for the added value of the three-point shot, the Warriors surpassed the 2013-14 Heat as the best field goal shooting team in NBA history.
  • Best True Shooting Percentage since at least 1983-84: The Warriors also bested the 2013-14 Heat for best True Shooting Percentage since 1983-84.
  • Most 3-pointers made per game in NBA history: Last season the Rockets set this record by making 11.4 3-pointers per game. The Warriors made over 13 per game.
  • 2nd-best 3-point FG% in NBA history: Incredibly, the same team that set the record for makes also managed to have the 2nd-best 3-point percentage in NBA history. It should be noted that the only team with a better 3-point field goal percentage, the 1996-97 Hornets, did so during a season in which the 3-point line was closer to the basket (22 feet all around).

Posted in Advanced Stats, Announcement, Basketball-Reference.com, Data, History, Play Index | Comments Off on 2015-16 Warriors Enter NBA Record Book

Kobe Bryant Has Always Had Fascinating Goodbyes

13th April 2016

As Kobe Bean Bryant bids farewell to the NBA, you'll likely hear a lot about all of the great accomplishments during his Hall of Fame career. The buzzer beaters, the 81-point game, the rings, the All-NBA teams, the All-Defense teams, the MVP votes. His great achievements literally go on and on. It's why most consider him one of the greatest guards in the history of the game. These accomplishments should be acknowledged, and chances are you've been hearing about them a lot this week.

However, as Kobe says goodbye tonight, I wanted to look at a part of his legacy that has always fascinated me: the way that he has said goodbye in past seasons. Bryant is considered by many to be one of the all-time great postseason performers. The reasons are obvious: He has five rings and two NBA Finals MVPs. He's the third-leading scorer in NBA Postseason history. However, the ultimate test of a superstar player is how they perform with their back against the wall. So I decided to examine Bryant's performance when facing playoff elimination. I did the same for some players with whom he's often compared: Michael Jordan & LeBron James.

First, let me be explicit: By "facing elimination" I mean any playoff game in which a loss would mean the end of his team's season. So these are games in which his team entered with two losses in a best-of-5 series or three losses in a best-of-7 series.

It turns out Bryant faced elimination 19 times in his career. The table below shows his statistics in these 19 games, with links to the box scores for each (by clicking the date). You'll notice that, coincidentally, the first two elimination games of the Black Mamba's career were against the Jazz (the same team he will finish his career against tonight).

Date Tm Opp MP FG FGA 3P 3PA FT FTA TRB AST STL BLK TOV PTS GmSc
1997-05-12 LAL UTA L 29 4 14 0 6 3 3 2 2 1 0 1 11 3.6
1998-05-24 LAL UTA L 19 2 2 0 0 2 3 1 0 1 1 3 6 2.8
1999-05-23 LAL SAS L 40 7 16 1 3 1 2 8 3 0 0 3 16 7.5
2000-05-05 LAL SAC W 34 7 16 1 5 2 2 2 6 0 3 1 17 13.7
2000-06-04 LAL POR W 47 9 19 1 4 6 12 11 7 0 4 2 25 20.3
2002-05-31 LAL SAC W 44 10 20 0 0 11 11 11 5 0 0 1 31 26.4
2002-06-02 LAL SAC W 52 10 26 2 3 8 10 10 7 2 0 0 30 24.1
2003-05-15 LAL SAS L 43 9 19 2 5 0 2 2 6 1 0 7 20 6.7
2004-06-15 LAL DET L 45 7 21 0 2 10 11 3 4 1 0 3 24 13.0
2006-05-06 LAL PHO L 43 8 16 4 8 4 5 4 1 0 1 3 24 13.6
2007-05-02 LAL PHO L 46 13 33 2 8 6 7 4 1 1 0 6 34 11.8
2008-06-15 LAL BOS W 44 8 21 4 9 5 7 7 4 5 0 6 25 16.2
2008-06-17 LAL BOS L 43 7 22 3 9 5 5 3 1 1 0 4 22 8.0
2009-05-17 LAL HOU W 33 4 12 1 4 5 6 7 5 3 2 1 14 14.6
2010-06-15 LAL BOS W 40 9 19 1 4 7 7 11 3 4 0 2 26 24.1
2010-06-17 LAL BOS W 45 6 24 0 6 11 15 15 2 1 0 4 23 9.9
2011-05-08 LAL DAL L 37 7 18 0 5 3 4 3 1 0 0 5 17 3.4
2012-05-12 LAL DEN W 45 7 16 2 2 1 4 1 8 0 1 3 17 10.6
2012-05-21 LAL OKC L 41 18 33 1 6 5 7 5 0 2 0 2 42 25.6
Provided by Basketball-Reference.com: View Original Table
Generated 4/12/2016.

It should be noted that in 1997 and 1998, Bryant was a teenager coming off the bench for the Lakers and did not always see consistent minutes. LeBron and MJ were never in the playoffs as teens, so it's probably unfair to include those years in any comparison. That said, here's Vino's averages in the 17 elimination games he played after becoming a starter. We've also listed the averages for Jordan and James in such games (and have even thrown in Allen Iverson, as a control of sorts, for those who think MJ & LeBron set an impossible standard):

Screen Shot 2016-04-13 at 11.07.22 AM

The first thing you'll note is that Bryant is the only of the four to have a winning record in these games (though that record falls to 9-10 if you include losses to the Jazz in his first two seasons). However, you'll notice his personal statistics are a cut below the other players on the list, especially Jordan and James. Of the four, Bryant ranks last a scorer, 2nd-worst in shooting efficiency, 2nd-worst in rebounding, and last in assists. Add it all up and Bryant's average Game Score when facing elimination is 14.7. Game Score was created by John Hollinger to give a rough estimate of a player's productivity for a single game. The scale is similar to that of points scored, so 40 is an outstanding performance and 10 is average. Needless to say, a 14.7 average Game Score in contests of this level of import is very pedestrian for a player of Kobe's standing. For further perspective, Bryant's average Game Score for his entire career is 17.4.

Michael Jordan, meanwhile, was predictably outstanding in these games as he averaged about 31 PPG, 8 RPG and 7 APG, with efficient shooting numbers. His Game Score average of 23.3 crushes Bryant's 14.7. LeBron James, contrary to his reputation, has even better numbers than Jordan in these games, ranking as the best scorer, rebounder and shooter of the group. His average Game Score of 23.7 is also the best. Allen Iverson, meanwhile, put up big scoring and assists numbers, but was the least efficient shooter of the group (though his TS% is close to Kobe's). Still, Iverson's 18.3 Game Score average puts him well ahead of Bryant.

In addition to the relative lack of individual success, the other striking thing about Bryant in these games is the magnitude of several of the losses. It's absolutely incredible that a player on so many great teams was also a part of so many season-ending meltdowns. Let's review:

If you're counting at home, that's four losses by 28+ points when facing playoff elimination. Does Kobe have one more dramatic ending in store for us?

Attached below are tables showing the elimination games of the other players mentioned in this post.

MICHAEL JORDAN IN ELIMINATION GAMES
Date Tm Opp MP FG FGA 3P 3PA FT FTA TRB AST STL BLK TOV PTS GmSc
1985-04-24 CHI MIL W 42 12 26 0 1 11 16 8 7 4 1 3 35 28.2
1985-04-26 CHI MIL L 42 6 16 0 2 17 20 7 5 2 3 4 29 24.3
1986-04-22 CHI BOS L 39 8 18 1 1 2 3 10 9 2 1 5 19 15.4
1987-04-28 CHI BOS L 39 9 30 0 1 12 14 11 7 2 1 2 30 21.5
1988-05-08 CHI CLE W 43 12 22 0 0 15 18 4 6 2 2 7 39 27.8
1988-05-18 CHI DET L 43 10 22 1 2 4 7 8 8 2 0 3 25 18.6
1989-05-07 CHI CLE W 44 17 32 1 1 9 13 9 6 1 0 2 44 32.7
1989-06-02 CHI DET L 42 13 26 1 2 5 12 4 13 3 2 8 32 20.9
1990-06-01 CHI DET W 39 11 20 1 4 6 6 10 2 1 0 3 29 20.6
1990-06-03 CHI DET L 45 13 27 0 2 5 5 8 9 1 0 4 31 23.0
1992-05-17 CHI NYK W 42 15 29 0 0 12 13 6 4 2 3 5 42 31.0
1995-05-18 CHI ORL L 39 8 19 1 2 7 10 9 7 4 4 6 24 19.9
1998-05-31 CHI IND W 42 9 25 0 0 10 15 9 8 0 0 2 28 19.2
Provided by Basketball-Reference.com: View Original Table
Generated 4/12/2016.
LeBRON JAMES IN ELIMINATION GAMES
Date Tm Opp MP FG FGA 3P 3PA FT FTA TRB AST STL BLK TOV PTS GmSc
2006-05-21 CLE DET L 47 11 24 0 4 5 8 8 2 1 0 3 27 15.6
2007-06-14 CLE SAS L 46 10 30 2 7 2 6 6 10 0 0 6 24 7.8
2008-05-16 CLE BOS W 47 9 23 1 3 13 15 12 6 2 1 8 32 21.6
2008-05-18 CLE BOS L 47 14 29 3 11 14 19 5 6 2 0 2 45 32.8
2009-05-28 CLE ORL W 46 11 24 0 2 15 19 14 12 1 1 4 37 33.3
2009-05-30 CLE ORL L 45 8 20 2 8 7 11 7 7 0 1 3 25 16.1
2010-05-13 CLE BOS L 46 8 21 2 4 9 12 19 10 3 1 9 27 22.1
2011-06-12 MIA DAL L 40 9 15 2 5 1 4 4 6 1 1 6 21 13.6
2012-06-07 MIA BOS W 45 19 26 2 4 5 9 15 5 0 0 4 45 36.4
2012-06-09 MIA BOS W 48 9 21 1 5 12 17 12 2 1 1 3 31 22.4
2013-06-03 MIA IND W 41 8 17 1 2 15 16 8 4 2 1 2 32 29.2
2013-06-18 MIA SAS W 50 11 26 1 5 9 12 10 11 3 1 6 32 25.8
2013-06-20 MIA SAS W 45 12 23 5 10 8 8 12 4 2 0 2 37 32.5
2014-06-15 MIA SAS L 41 10 21 3 9 8 9 10 5 0 2 1 31 26.8
2015-06-16 CLE GSW L 47 13 33 2 10 4 8 18 9 2 0 6 32 20.2
Provided by Basketball-Reference.com: View Original Table
Generated 4/12/2016.
ALLEN IVERSON IN ELIMINATION GAMES
Date Tm Opp MP FG FGA 3P 3PA FT FTA TRB AST STL BLK TOV PTS GmSc
1999-05-23 PHI IND L 45 11 28 2 6 1 1 3 6 0 0 2 25 12.5
2000-05-13 PHI IND W 45 7 26 1 4 4 6 3 5 2 0 3 19 6.2
2000-05-15 PHI IND W 46 12 29 2 4 11 12 5 1 1 0 1 37 22.5
2000-05-19 PHI IND L 44 7 20 1 4 3 5 5 3 2 0 2 18 10.0
2001-05-20 PHI TOR W 48 8 27 1 3 4 4 4 16 2 1 4 21 16.0
2001-06-03 PHI MIL W 44 17 33 4 6 6 7 6 7 2 0 2 44 32.8
2001-06-15 PHI LAL L 45 14 32 3 11 6 8 3 2 2 0 3 37 18.7
2002-04-28 PHI BOS W 44 10 23 3 5 19 20 5 4 5 0 3 42 34.6
2002-05-01 PHI BOS W 42 9 26 1 5 9 10 5 4 4 0 4 28 16.9
2002-05-03 PHI BOS L 44 11 24 4 7 5 8 2 4 1 0 1 31 20.4
2003-05-16 PHI DET L 53 14 33 1 1 9 10 3 9 2 1 5 38 24.2
2005-05-03 PHI DET L 48 14 30 1 5 5 6 1 7 0 0 4 34 18.2
2007-05-02 DEN SAS L 44 6 22 2 5 7 9 0 8 2 0 3 21 11.8
2008-04-28 DEN LAL L 43 10 22 0 3 2 3 2 2 0 0 1 22 11.6
Provided by Basketball-Reference.com: View Original Table
Generated 4/13/2016.

Posted in Announcement, Basketball-Reference.com, Data, History, Playoffs, Uncategorized | Comments Off on Kobe Bryant Has Always Had Fascinating Goodbyes

24 Things You Didn’t Know About Kobe Bryant

7th April 2016

In a little under a week, Kobe Bryant will walk onto the floor of the Staples Center for the final time as a player. For good and ill, no player has come to define the post-Jordan, pre-LeBron generation more than Kobe. However, Kobe's off-floor notoriety hasn't always matched his on-the-court achievements. Tim Duncan, Kevin Garnett, and Dirk Nowitzki all have more Win Shares than Kobe. Steve Nash has more MVP awards and Allen Iverson has spent more years leading the NBA in Points Per Game.

Yet it's Kobe who has come to be the face of the late 1990s and early 2000s in the NBA. He's proof of the adage that the opposite of love isn't hate, but indifference. Unlike Duncan, who never generated strong feelings, or Dirk, beloved but never feared or loathed, Kobe is a player who was fiercely debated and scrutinized. His game, and your feelings about it, say a lot about what you're looking for in a basketball player and where you see the NBA going.

So, as his career winds down, let's take a look back. I scoured the Basketball-Reference database and found 24 facts, in bold, that shed light on both sides and explain dig into Kobe's complicated, nuanced legacy as an NBA player.

Kobe's Scoring

We'll start with something you probably do know. Kobe scored. A lot. He'll finish 3rd all-time in points, behind Kareem Abdul-Jabbar and Karl Malone.

Of course, Kobe's scoring comes with the caveat that he played a lot. Bryant is one of 5 players with 20 years in the NBA, one more than Malone and five more than Michael Jordan, who is in 4th in points. If you look at PPG, Kobe is 12th all-time, impressive but more in line with how he ranked as a scorer.

It's also notable because Kobe had fewer career PPG than his contemporary, newly-minted HoF Inductee Allen Iverson. AI also had 4 30-PPG seasons, as opposed to Kobe's 3. Iverson's scoring edge over Kobe, however, is also related to the fact that AI played so many more minutes than Kobe (he had a nearly Wilt-esque 11 seasons with 40 or more Minutes Per Game).

So, Iverson played more but Kobe played longer. Using the Player Comparison Finder, we can adjust for both. Here's what their per 36 minutes stats look like (along with Vince Carter and Tracy McGrady, who are also part of this cohort) through 2009-10, AI's last season:

Rk Player From FG% TRB AST STL BLK PTS
1 Kobe Bryant 1997 .455 5.2 4.6 1.5 0.5 24.8
2 Vince Carter 1999 .445 5.2 4.0 1.2 0.7 22.2
3 Allen Iverson* 1997 .425 3.3 5.4 1.9 0.2 23.3
4 Tracy McGrady 1998 .435 6.2 4.9 1.3 1.0 22.4
Provided by Basketball-Reference.com: View Original Table
Generated 4/6/2016.

So, of the four, Kobe was the most proficient scorer on a per-minute basis, as well as the most efficient. But, AI was actually the best playmaker of the bunch (hold that thought on Kobe's playmaking). And, of course, T-Mac got boards.

So who was the best scoring 2-guard of his era, the true heir to Jordan? As much as I love Iverson, Kobe's case is quite strong.

Kobe's Rings

Everyone knows, by heart, the most popular argument by Kobe's legion of fans: "Count the rings." And yet, if you dig a little deeper, Kobe's 23 wins in NBA Finals games are actually only good for a tie for 8th most since 1963. He doesn't even have the most Finals wins of players on those Lakers teams; Derek Fisher has 24, thanks to his stint with the Oklahoma City Thunder.

What's more, Kobe never led any Championship team in Win Shares. It won't come as any surprise that the 1999-2000 Lakers, 2000-2001 Lakers, and 2001-2002 Lakers were all led by Shaq, however, Pau Gasol had the most Win Shares on both the 2008-09 and 2009-10 Lakers. Perhaps just as much of a problem is Kobe did lead the 2003-04 Lakers and 2007-08 Lakers in Win Shares, both teams that ultimately lost in the Finals (although, technically Pau had more Win Shares per 48 Minutes than Kobe, suggesting he was actually their best player, and just didn't come over till around the trade deadline).

Kobe did lead the Lakers in playoff Win Shares in 2001 (barely) and 2009, but this still shades Kobe's case when it comes to the rings. For comparison's sake, Dwyane Wade made 5 Finals, 2 fewer than Kobe, but he had the most WS on the 2006 Heat, meaning he was the best player on a championship team more than Kobe was. Dirk made 2 NBA Finals as his team's WS leader, like Kobe, but he won one of those times. It's almost like basketball is a team sport and requires several very good players to win!

Kobe's Playmaking

Of course, you're probably also familiar with the biggest knock on Kobe: He's selfish. It's an image that Kobe hasn't seemed particularly worried about, and has even played up by spending the last couple of years as an unrepentant gunner. But the stats don't back it up. By a lot of measures, Kobe is one of the best assisting 2-guards ever.

Among players listed at 6'6" or taller, Kobe has the 12th highest career Assist Percentage, better than famously generous distributors like Chris Webber and Grant Hill. His 86 10-assist games are 10 more than Michael Jordan had in his career.

It's not that Kobe didn't chuck, it's that the Lakers got them a man who can do both. Kobe had 13 seasons with a Usage Rate over 30% and an Assist Rate over 20%, the most by any player since 1973, the first year we have those stats. LeBron seems likely to surpass that, but it's not a sure thing. And D-Wade, the only other player in double-digits, almost certainly won't.

That even includes 2005-06, the year when Kobe had the highest USG% of all-time. Even then, he still managed to have a 24.1% Assist Rate, diming to Smush Parker and Kwame Brown

Kobe's Rebounding

It's no surprise that a 6'6" man who spent 20 years in the NBA has the 3rd most career rebounds by a G, G-F, or F-G, however Kobe's rebounding ability goes beyond just raw counting stats. His rebounding percentage from 1997-2012 is 15th among G and G-F with at least 10,000 MP in that time period. To put it in perspective, his TRB% of 8.2 was just one point of off Rajon Rondo in that time span, and ahead of both Wade and Russell Westbrook (though Westbrook didn't really become a the menace on the boards he is now until 2013).

Kobe's...Efficiency?

Efficiency isn't a word that we'd associate with Kobe, the NBA's leader in career missed Field Goals, but, in his own way, Kobe was about as efficient as you could want from someone with his level of scoring responsibility (at least, if you exclude whatever alien race Stephen Curry belongs to).

Of the 24 players who took at least 15,000 FGAs in their career, Kobe's True Shooting Percentage ranks a respectable 10th, one spot ahead of Jerry West, and his Effective Field Goal Percentage is 8th among players who averaged 19 or more Field Goal Attempts per game

Efficiency is a bit of a moving target depending on volume. The bar for a creator like Kobe to be a good scorer is different from what we'd expect from someone like Shane Battier.

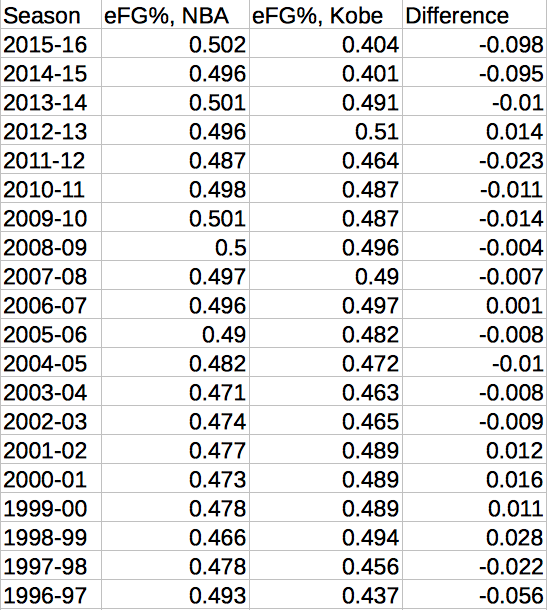
It was also a different time. Even with all the shooting, Kobe's eFG% was better than the NBA average 5 times in his career, and it was within .01 7 more:

Screen Shot 2016-04-06 at 3.59.24 PM

Lastly, Kobe was great at drawing the most efficient shot there is: Free Throws. No wing took more Free Throw Attempts in their career than Kobe.

Kobe's Peak

The focus on his championships means that Kobe's peak, oddly, is underrated. His peak mostly fell during the barren post-Shaq, pre-Pau era, but we shouldn't ignore how dominant Kobe was in that era because he didn't win it all.

Kobe's age 27-29 seasons combined rank 14th in WS and 12th in Player Efficiency Rating among players that age, much higher than his career rankings of 18th in WS and 25th in PER.

Expanding it out to ages 21-34, Kobe ranks just as strong. He's 12th in WS, 14th in PER, and 12th in Value Over Replacement Player.

Again, this contradicts the narrative. We think of Kobe as sticking around the NBA to pad his career stats (and make an absurd amount of money). But, while his counting stats have gone up, it's also watered down some of his numbers with below-average seasons.

Kobe in the Playoffs

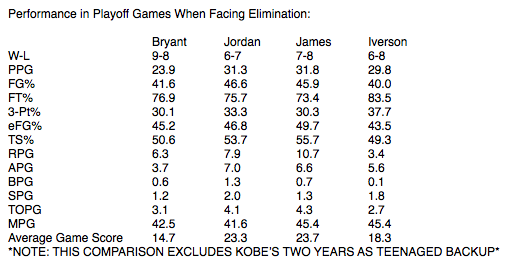
While the Rings argument is somewhat specious, there's no denying Kobe's greatness in the playoffs. Kobe is 8th all-time in Playoff WS and, from 2000, our first year of plus/minus, to 2012, his last playoff appearance, Kobe has 105 playoff games with a positive plus/minus, trailing only Derek Fisher in that period of time (and, notably, leading Duncan).

You also might have heard that Kobe's not afraid to take the big shot. Since 2000, he's taken 122 Field Goal Attempts in the last 2:00 of the 4th quarter or OT when the game was within 5 points. In other words, that's 122 crunch time shots. Since 2000, only LeBron has taken more.

Screen Shot 2016-04-06 at 4.48.25 PM

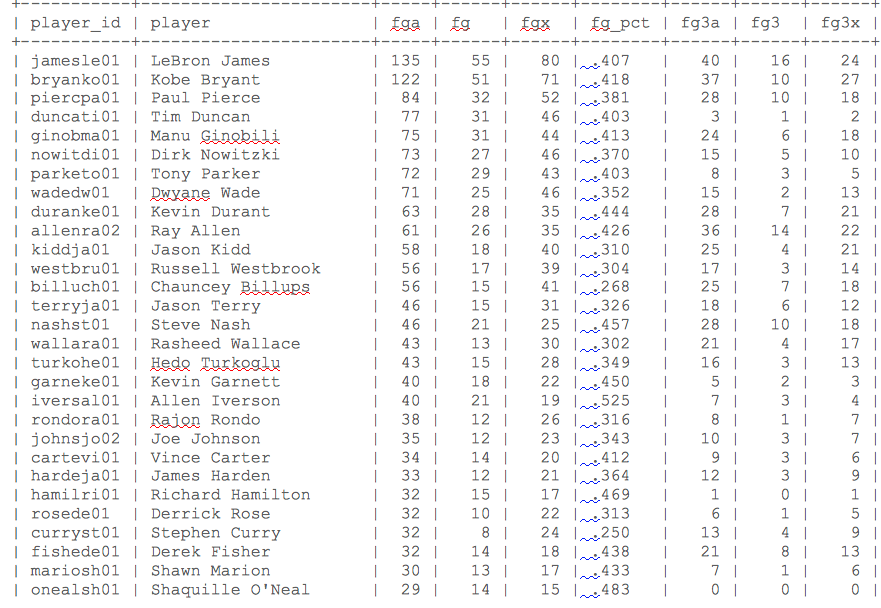
Not only that, but you might have noticed Kobe's Field Goal Percentage of .418 on those shots. You have to scroll all the way down to KD or Ray Allen, who've taken half as many clutch shots as Kobe, to find a better FG%. LeBron has a claim, especially considering that he likely has several more playoff runs ahead of him, but for now, Kobe has an excellent argument for the best clutch shooter of the 2000s.

Kobe's Advanced Stats

Maybe you aren't impressed by traditional stats and want to see what Basketball-Reference's play-by-play data says. Well, since 2000, Kobe's teams have been 6.8 points per 100 possessions better with him on the floor. The Lakers' eFG% is 20 points higher, and, despite Kobe's poor defensive reputation in recent years, their Defensive Rating is basically unchanged. Oh, and in the playoffs, that plus/minus figure goes up to 8.1 points per 100 when Kobe's on the floor.

The debate over Kobe's legacy seems to have cooled off in recent months. This can't be how Kobe wanted to go out, adulated but not feared, celebrated because he poses no real threat anymore. As a competitor and a person, Kobe seemed to thrive off the hate. We may disagree about the breadth and reach of Kobe's legacy, but as these stats show, the fact of that legacy can't be debated.


Posted in Announcement, Basketball-Reference.com | 27 Comments »

Sports Reference’s Tonsorial Consulting Service Expands to Basketball

1st April 2016

Last year, to great fanfare and critical acclaim, we announced the Baseball Reference Tonsorial Consulting Service, a feature that allowed the segment of our users who also happen to be baseball players to experiment with new directions for their hairstyle and/or facial hair. The results were astonishing. While we're not at liberty to divulge the names of our clients, we think you will agree that 2015 was an excellent year for hair in baseball.

baseball

We want to thank everyone who participated in our pilot program. We're pleased to announce that for 2016, the B-R Tonsorial Consulting Service will be expanding to the professional basketball!

TCS


Go to any active player (and some retired one) and give yourself a new look free of charge.

Read the rest of this entry

Posted in Basketball-Reference.com | Comments Off on Sports Reference’s Tonsorial Consulting Service Expands to Basketball