Posted by Mike on October 23, 2014
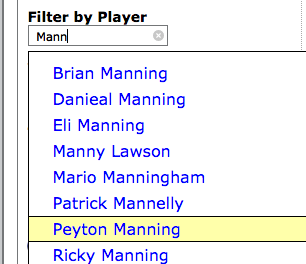 We've added a text input to the top of the game play finder tool which works similar to our search autocomplete - start entering a player name and select the player you want from the dropdown and it will filter to show only plays in which that player was involved. For instance, if you want to see all of Peyton Manning's passing touchdowns or all of Devin Hester's touchdowns.
The play finder will now show defensive player stats as well, so you can search for something like all of Charles Woodson's interceptions returned for a touchdown and see which quarterbacks were the unlucky victims.
We've added selectors for QB kneels and sacks to the middle column as well, so you can get things like Russell Wilson's yards per rush with kneels excluded.
Finally, we've also added pass/rush distances and directions under [+] Pass/Rush Direction Options at the bottom of the form - clicking that link will expand the form to allow you to pick rush direction or pass location. This will let you fine-tune your searches, so you can find how the Eagles performed on deep passes to DeSean Jackson in 2013 or who's most successful running up the middle in 2014. Note that these are reliant on the play-by-play data of the plays (and so their definition of direction and distance) and a "deep" pass is considered to be one that travels 15+ yards in the air.
Posted in Announcement, Pro-Football-Reference.com | 1 Comment »
Posted by sean on October 21, 2014
Just a note that we added per possession statistics to the player pages on our college site. In particular, we express these as per 100 team possessions, which we estimate using component stats* and which we can calculate for every D-I school beginning with the 2010-11 season.
We recently added these to Basketball Reference so that users could easily compare output from different teams or eras, however the disparities in pace of play are even greater in college. Miami (Fl.) had the slowest pace in 2013-14 at 59.1 team possessions per game. On the other hand, Northwestern State and Virginia Military Institute led the NCAA at 78.9 and 77.5, respectively.
For now you can find these tables on the player pages:

And we'll be adding per possession statistics to the school pages, season registers and play-index tools soon enough.
*team_poss = 0.5 x ((fga + 0.475 x fta - orb + tov) + (opp_fga + 0.475 x opp_fta - opp_orb + opp_tov))
Posted in Announcement, Basketball-Reference.com, CBB at Sports Reference | Comments Off on Per Possession Player Stats Added to College Basketball
Posted by Mike on October 20, 2014
Since Peyton Manning has been in the news a bit today due to his new ownership of the all-time passing TD record, we've gotten a few questions on our Twitter account about progressive leaderboards:
We already had single season progressive leaderboards but today we've added career progressive leaderboards so that you can see who was the NFL's career passing touchdown leader in 1966? You can also see on that list where they rank as of the latest games, so #1 Y.A. Tittle in 1966 has the 19th-highest touchdown pass total in the current day.
You can get to a full list of the career or single-season progressive leaders by going to our main leaderboard index and selecting a stat and a year or from the box on the right of any of the career leaders lists.
Posted in Announcement, Pro-Football-Reference.com | 3 Comments »
Posted by TiqIQ Staff on October 20, 2014
The home viewing experience for NFL games is the best it’s ever been. With that, the process of going to a game on Sunday can be a bigger hassle when factoring in all parts of the Fan Cost Index. Some struggles to bring fans to the games lead to things like a fantasy football section in the stadium or poolside cabanas in Jacksonville. On the secondary ticket market, there’s a few different factors that set the level of demand for NFL tickets. Market size will always be one of the biggest factors, as is quality of competition on a game by game basis. One thing the team itself can control to typically keep demand high is presenting a good on field product.
Using the past five seasons of TiqIQ secondary market data and the past five years of team SRS, we can see which teams have the strongest correlation of ticket prices to team success. After running the numbers, 12 teams came out with a correlation of .4 or higher. Another seven teams had a negative correlation of -.4 or below.
The strongest positive correlation came from the Denver Broncos at .99. The average price for Broncos tickets has risen every season since 2010, as has their SRS. In 2010 the Broncos had an SRS of -8.9, an average home price of $120.66 and Kyle Orton at quarterback. This season, the Broncos have an average home price of $339.71 as they are again one of the top teams in the NFL with Peyton Manning. The $339.71 average price is the fifth highest in the league this season.
New Orleans, Washington and Seattle were the only three other teams to have a correlation above .7. Seahawks tickets follow a similar trend to the Broncos. In 2010 the Seahawks had an SRS of -9.4 and a season average on the secondary market below $100. This season, the average price for a home game in Seattle is $398.51, the most expensive price in the league.
Cowboys tickets had the fifth strongest correlation at .69. While the average price for a home game at AT&T Stadium is usually among the top half of the league, the actual average has risen and dipped with the team’s performance. Unsurprisingly, the $260.23 average price at AT&T Stadium is the most expensive over the past five years.
The strongest negative correlation came from teams that have not been particularly good over the past five seasons — the Tennessee Titans, Oakland Raiders, Tampa Bay Buccaneers and Jacksonville Jaguars. The most interesting team in the bottom five is the Atlanta Falcons. The price of Falcons tickets on the secondary market have remained consistent — around a $130 to $150 average price through the years atop the NFC South and the struggles over the past two seasons.
Posted in Advanced Stats, Announcement, Pro-Football-Reference.com | Comments Off on The Relationship Between SRS and NFL Ticket Prices
Posted by Mike Lynch on October 15, 2014
We've recently made a huge enhancement to the search capabilities in the Team Game Finder. You can now search for games in which a team had more or less of one statistic than another. That probably sounds vague, so let's get into some concrete examples:
We hope you enjoy this new feature and please let us know if you discover anything cool with it.
Posted in Announcement, Data, Play Index, Pro-Football-Reference.com | 6 Comments »
Posted by Mike Lynch on October 14, 2014
Ever wanted to see every touchdown scored and allowed by a team in a season in an easy, sortable table? If you answered "yes", you're in luck. Today we've rolled out those tables on team pages for every team in APFA/NFL history. So you can now find such a table for the 1920 Decatur Staleys & also for the 2014 Philadelphia Eagles. These tables can be found at the bottom the main page for each team.
And don't forget that even larger tables can be generated via our Player Touchdown Finder in the Play Index.
Posted in Announcement, Data, Features, Pro-Football-Reference.com | Comments Off on Team & Opponent TD Logs Added to Team Pages
Posted by Mike Lynch on October 9, 2014
We've recently added a few cool features to the Team Game Finder that we wanted to update everyone on.
The first addition was inspired by the slew of return TDs scored by the Eagles in the first 5 weeks of this season. It sure seemed extreme, but we had no way of placing it into perspective via the Play Index. Well, now we do. We've added a function to search for all Return TDs (any TD that is not passing or rushing). It turns out, the Eagles are the only team since 1940 to score 7+ Return TDs in their first 5 games. The 1998 Seahawks had 13 such scores, the most in a season since 1940.
We have also added penalty & penalty yards data to the game finder. I'm sure our users won't be shocked to discover that the Raiders have 6 of the 8 most penalized teams since the merger. And the 1998 49ers had the most penalties by any team in a win since the merger, with 22 at Buffalo. Our penalty data is mostly complete back to 1950, but we'd recommend restricting searches to post-merger for the best accuracy.
Posted in Announcement, Data, Features, Play Index, Pro-Football-Reference.com | 1 Comment »
Posted by sean on October 8, 2014
Since we've launched the various Play Index tools on our sites, we've struggled with the best way to monetize what we feel is the deepest and most powerful set of sports data tools anywhere. We know they are useful, our users, the teams, broadcast networks, and newspaper reporters tell us so.
On baseball, we charge an annual fee of $36, but our best guess is that the traffic and audience of the other sites would not be sufficient to make a subscription model worth our while. We have been running traditional banner ads on those pages, but they pay so little and the play index content is niche content (valuable, but niche content) so the traffic will never rise that high on the play index pages. So we have decided to remove all banner advertising and instead run Google consumer surveys on the non-baseball play index pages.
Here's how it works. The first time you run a report each day your results will be obscured and you will be asked to answer a 1-5 question survey. After you answer the survey, your requested report will be shown to you and you won't see another survey for that site on that browser for 24 hours (multi-question surveys are good for 48 hours). These surveys pay us around 5 cents per survey which, while it doesn't sound like much, is about 15 times what we would get from banner ads on those pages. Here is an FAQ if you are wondering how Google uses this information.
Also, if you find these gateway surveys a step too far, consider subscribing to our Ad-Free Access. Starting at $20/year you can surf every Sports Reference page ad and survey free.
If you are wondering what our play index tools are, give them a try. We think you'll enjoy them.
Play Index at Basketball-Reference.com
Play Index at Pro-Football-Reference.com
Play Index at Hockey-Reference.com
Play Index at Sports-Reference.com/cbb
Play Index at Sports-Reference.com/cfb
Posted in Advanced Stats, Announcement, Basketball-Reference.com, CBB at Sports Reference, CFB at Sports Reference, Hockey-Reference.com, Pro-Football-Reference.com | Comments Off on Play Index Tools Now with Short Surveys & no Ads
Posted by Mike Lynch on October 8, 2014
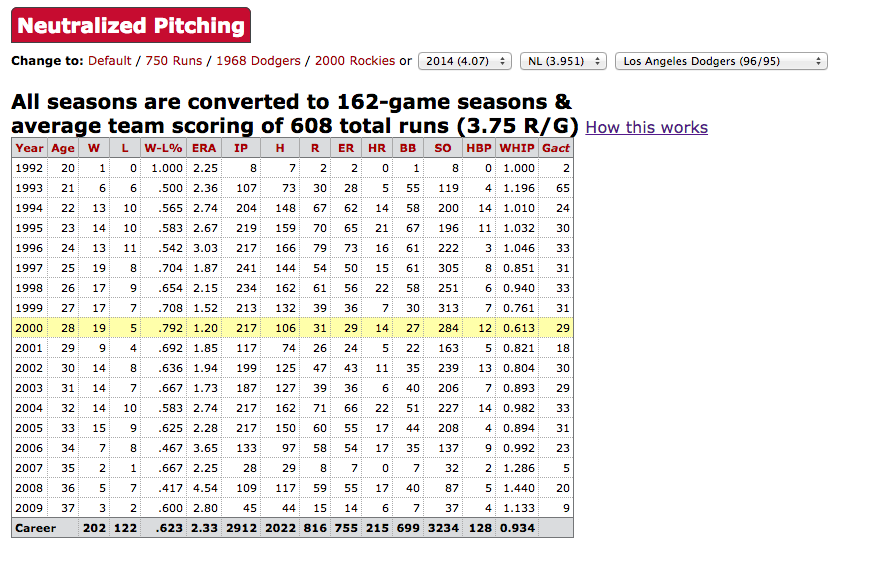
Just a quick announcement that the 2014 season has been added as an option to our Neutralized Stats tables. As a reminder, these tables can be found by clicking on "More Stats" on player pages and then scrolling down to the neutralized section.
This feature allows us to compare players across eras. For instance, the image below shows how each of Pedro Martinez's seasons would have looked if pitching in the environment of the 2014 Dodgers:
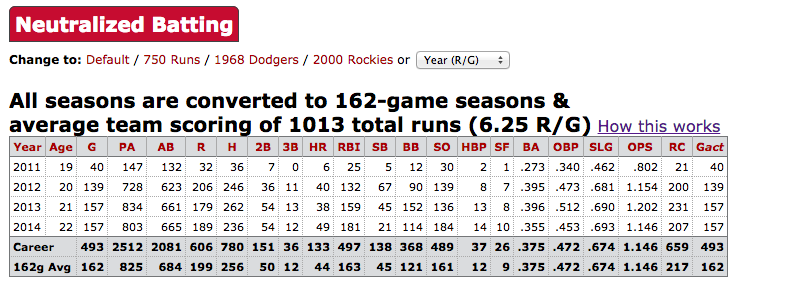
 The same adjustments can be applied to batting numbers, as well. For instance, check out Mike Trout's statistics translated to the batting environment of the 2000 Rockies:
Posted in Announcement, Baseball-Reference.com, Data, Features | 3 Comments »
Posted by sean on October 8, 2014
Earlier this week we introduced new advanced search options into our shooting splits tool.
In case you didn't know before, we have detailed shooting data for every player since 2000-01, and detailed splits are available by going to a player's page and hovering your mouse cursor over 'Shooting':

Now, you can click on the [+] next to 'show advanced options' and you'll see two new advanced tools.
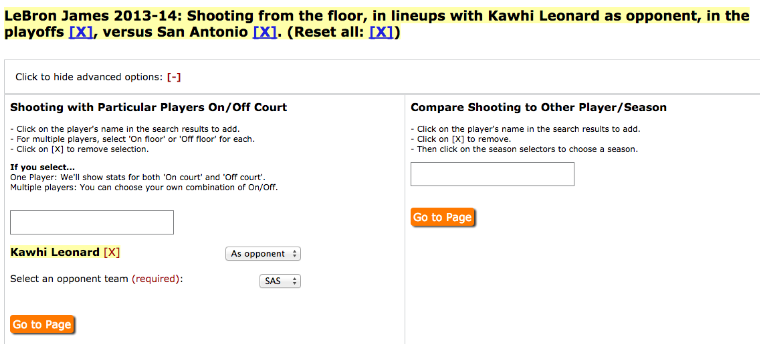
On the left, type in a player's name and click the search result to add it. In most cases, it will automatically populate as 'As teammate' or 'As opponent'. This will show shooting splits for whoever's page you are on, with the selected player both on and off the court.
In fact, you can even add several players and select custom combinations of 'On' and 'Off'.
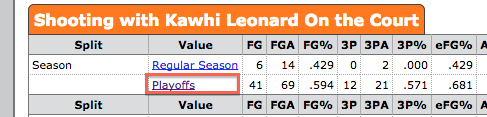
Check out how LeBron fared versus Kawhi Leonard in 2013-14 by adding Leonard's name, then clicking on 'Go to Page'.
You can check out the numbers for just the Finals by clicking on the 'Playoffs' link in the results (likewise, you can add any split to your query the same way).
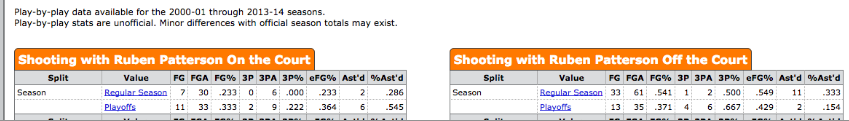
Why did Ruben Patterson call himself "Kobe Stopper". It might be these 2001-2002 numbers when Kobe went 18-63 with Patterson on the court, then 46-96 with him off:
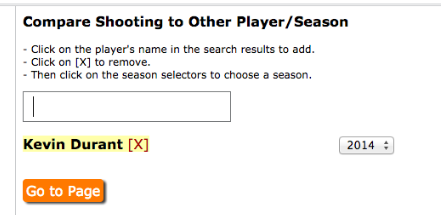
ALSO! The tool on the right lets you compare the player whose page you are on versus any other player, or any other season. It works the same way, that is, begin typing the name in the form and then click a season from the select box that appears.
Then click 'Go to Page' and you'll get a side-by-side comparison of that player's shooting splits versus his own or another player's, in whichever season you selected:
Posted in Advanced Stats, Announcement, Basketball-Reference.com, CBB at Sports Reference | 3 Comments »
 We've added a text input to the top of the game play finder tool which works similar to our search autocomplete - start entering a player name and select the player you want from the dropdown and it will filter to show only plays in which that player was involved. For instance, if you want to see all of Peyton Manning's passing touchdowns or all of Devin Hester's touchdowns.


We're Social...for Statheads
Every Sports Reference Social Media Account
Site Last Updated: Friday, May 1, 2:56PM
Question, Comment, Feedback, or Correction?
Subscribe to our Free Email Newsletter
Do you have a sports website? Or write about sports? We have tools and resources that can help you use sports data. Find out more.