Sports Reference Blog
Heat Maps Added to Shooting Splits
Posted by Justin Kubatko on March 13, 2013
This is just a short post to let you know that I have added heat maps to the shooting splits. Here is an example:
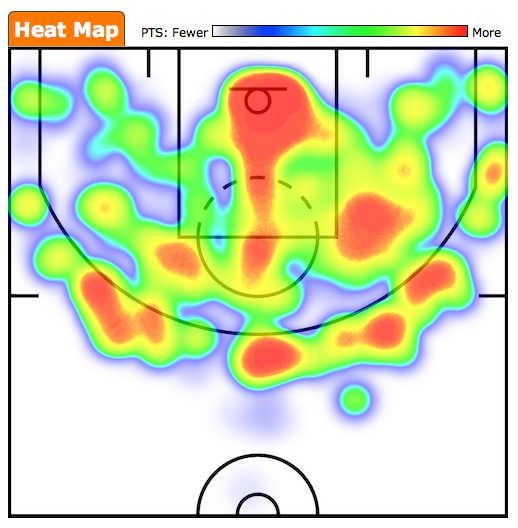
The coloring is based on points scored, so areas with fewer points scored will have a blue shade while areas with more points scored will have a red shade.
The heat maps are generated on the fly, so when you drill down into the shooting splits the heat map will update as well. Be advised that for players who take a lot of shots (e.g., Kobe Bryant in 2005-06), the heat map may take a second or two to appear after the page is finished loading.
Thanks, that's a great addition!
However, would it be possible to add some options to the values represented in the heat map? That is, it would be nice to study, e.g., player's shooting percentages or the number of shots taken at different locations.
(By my understanding, the necessary data should be readily available?)
Keep up the good work!
Jirka
Ditto Jirka's comment. I'd much rather see eFG%, for example, from those locations.
Austin's Comment. yes eFG%, that would be nice. thanks and keep up the good work